
Videos
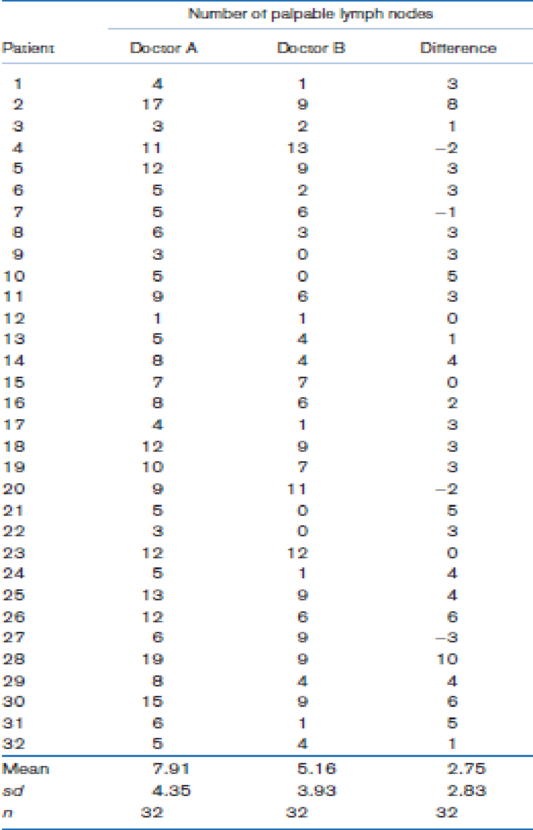
The degree of clinical agreement among physicians on the presence or absence of generalized lymphadenopathy was assessed in 32 randomly selected participants from a prospective study of male sexual contacts of men with acquired immunodeficiency syndrome (AIDS) or an AIDS-related condition (ARC) [8]. The total number of palpable lymph nodes was assessed by each of three physicians. Results from two of the three physicians are presented in Table 8.15.
Compute a 95% CI for the true
Table 8.15 Reproducibility of assessment of number of palpable lymph nodes among sexual contacts of AIDS or ARC patients
Perform the test in Problem 8.40, and report a p-value.
Want to see the full answer?
Check out a sample textbook solution
Chapter 8 Solutions
Fundamentals of Biostatistics


- A study was made of 1,057 cases of poisoning in children treated as inpatients at Milwaukee Children's Hospital from 1962 through 1968. Data on date of occurrence, age and sex of the child, and type of agent involved were recorded and analyzed by standard statistical methods. Poisoning was due to ingestion of aspirin in 35 per cent of the children studied and to the ingestion of hydrocarbon distillates in 18 per cent. A statistically significant male dominance was found for ingestion of hydrocarbons; age-specific peaks were found for some categories. Trends as to the relative and absolute frequencies of each specific poison from one year to the next were noted; possible reasons for increasing or decreasing trends are discussed. Is this study descriptive or inferential? Explain your answer. What are the variables used in the study? In your opinion, what level of measurement was used to obtain the data from the variables? Does the article define the population? If so, how is it…arrow_forwardThe article "Vehicle-Arrival Characteristics at Urban Uncontrolled Intersections" (V. Rengaraju and V. Rao, Journal of Transportation Engineering, 1995: 317-323) presents data on traffic characteristics at 10 intersections in Madras, India. One characteristic measured was the speeds of the vehicles traveling through the intersections. The accompanying table gives the 15th, 50th, and 85th percentiles of speed (in km/h) for two intersections. Percentile Intersection 15th 50th 85th 27.5 37.5 40.0 в 24.5 26.5 36.0 If a histogram for speeds of vehicles through intersection A were drawn, would it most likely be skewed to the left, skewed to the right, or approximately symmetric? Explain. b. If a histogram for speeds of vehicles through intersection B were drawn, would it most likely be skewed to the left, skewed to the right, or approximately symmetric? Explain. a.arrow_forward
 Glencoe Algebra 1, Student Edition, 9780079039897...AlgebraISBN:9780079039897Author:CarterPublisher:McGraw Hill
 Calculus For The Life SciencesCalculusISBN:9780321964038Author:GREENWELL, Raymond N., RITCHEY, Nathan P., Lial, Margaret L.Publisher:Pearson Addison Wesley,