
Concept explainers
Videos
The EPIC-Norfolk study, a study of diet and cancer in Great Britain, was performed to assess the relationship between dietary intake of vitamin C, plasma levels of vitamin C (in blood), and other predictors. One hypothesis is that smokers might have different vitamin C intake and vitamin C plasma levels than nonsmokers. Dietary intake of vitamin C was obtained using 7-day diet records in which a subject recorded what he or she ate in real time and a computer program was used to estimate nutrient intake based on the diet record data. The data in Table 8.40 were obtained for current smokers and nonsmokers.
Table 8.40 Association between current smoking and diet record intake of vitamin C in the EPIC-Norfolk Studya
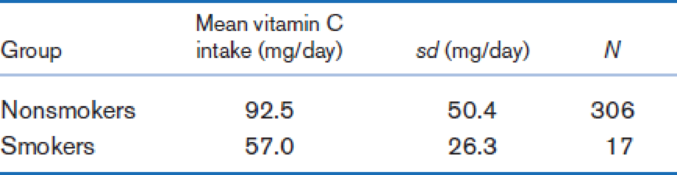
aDiet record intake includes intake from foods but not from vitamin supplements.
Perform the test in Problem 8.168, and identify whether there is a significant difference between the two variances (i.e., is p < .05 or p > .05?).
8.168 What test can be used to compare the standard deviation of diet record vitamin C intake between current smokers vs. nonsmokers?
Want to see the full answer?
Check out a sample textbook solution
Chapter 8 Solutions
Fundamentals of Biostatistics


- Does posting calorie content for menu items affect people’s choices in fast food restaurants? According to results obtained by Elbel, Gyamfi, and Kersh (2011), the answer is no. The researchers monitored the calorie content of food purchases for children and adolescents in four large fast food chains before and after mandatory labeling began in New York City. Although most of the adolescents reported noticing the calorie labels, apparently the labels had no effect on their choices. Data similar to the results obtained show an average of M = 786 calories per meal with s = 85 for n = 100 children and adolescents before the labeling, compared to an average of M = 772 calories with s = 91 for a similar sample of n = 100 after the mandatory posting. Use a two-tailed test with α = .05 to determine whether the mean number of calories after the posting is significantly different than before calorie content was posted. Calculate r2 to measure effect size for the mean difference.arrow_forwardAn important issue is whether there are racial differences in hypertension among children. We define hypertension as being above the 95th percentile for either systolic blood pressure (SBP) or diastolic blood pressure (DBP) among children of the same age, height, and sex. Since some of the children were observed at multiple visits, a GEE model was run of hypertension on ethnic group. There were three ethnic groups considered: Caucasian, African American, and Hispanic. One issue is that BMI, which may vary among ethnic groups, is positively related to hypertension. Hence, a logistic regression model was run, as shown in Table 13.55. 13.89 What is the estimated OR for hypertension comparing Hispanic boys vs. Caucasian boys based on the results in Table 13.55? (Call this OR2 .) Provide a 95% CI for this estimate. 13.90 Suppose the average BMI of Hispanic boys is higher than that for Caucasian boys. Is BMI a confounder of the association between ethnic group and hypertension? If so, is it…arrow_forwardAn important issue is whether there are racial differences in hypertension among children. We define hypertension as being above the 95th percentile for either systolic blood pressure (SBP) or diastolic blood pressure (DBP) among children of the same age, height, and sex. Since some of the children were observed at multiple visits, a GEE model was run of hypertension on ethnic group. There were three ethnic groups considered: Caucasian, African American, and Hispanic. The results among boys are given in Table 13.54. TABLE 13.54 Relationship between hypertension and ethnic group among 27,009 boys in the Pediatric Task Force Data Variable Regression Coefficient SE Intercept -2.07 0.026 African American 0.049 0.041 Hispanic 0.328 0.059 What is the estimated OR for hypertension comparing Hispanic boys vs. Caucasian boys? (Call this OR1.) What is a 95% CI for this estimate?arrow_forward
- Dr. Farah is an educational psychologist who is interested in studying the potential causal relationship between doing homework and academic achievement. In January, Dr. Farah has her students report their fall GPA (a measure of academic achievement) and estimate how many hours they spent doing homework during a typical week in the fall semester. In May, Dr. Farah measures the same variables again (the estimated number of hours spent doing homework during a typical week in the spring semester and their spring GPA). She finds the following correlations. Imagine that Dr. Farah noted a cyclical, reinforcing relationship between homework and academic achievement. For this to be case, which of the following correlations would need to be significant? a. Correlations 1 and 6 b. Correlations 2 and 5 c. Correlations 3 and 4 d. Correlations 2 and 3 Answer is C for this question. Why this one is the answer and others are not?arrow_forwardA survey revealed that a substantial proportion of university students were not engaging in regular exercise. In response to a question on regular exercise, 60% of all graduates reported getting no regular exercise, 25% reported exercising sporadically and 15% reported exercising regularly as undergraduates. The next year the University launched a health promotion campaign on campus in an attempt to increase healthy behaviors among undergraduates. To evaluate the impact of the program, the University again surveyed graduates and asked the same questions. The survey was completed by 470 graduates and the following data were collected on the exercise question: No Regular Exercise Sporadic Exercise Regular Exercise Total Number of Students 255 125 90 470 Based on the data, is there evidence of a shift in the distribution of responses to the exercise question following the implementation of the health promotion campaign on campus? Run the test at a 5% level of significance.arrow_forwardIndividuals with strong religious beliefs often turn to their faith to cope with stressful life events. Relying on God's love and caring is referred to as positive religious coping. Andrea Phelps and her colleagues studied the relationship between positive religious coping and the type of care received by terminally ill cancer patients. Most of the patients in the study were Christian. [Source: Phelps, A. et al., "Religious coping and use of intensive life-prolonging care near death in patients with advanced cancer." Journal of the American Medical Association, 301 (2009): 1140-1147.] Suppose another researcher conducts a similar study but uses a sample of patients whose religious traditions are more varied than the patients in the Phelps study. He samples 400 terminally ill patients to see whether their practicing a religion is related to how likely they are to seek intensive life-prolonging care. The following table shows the results of the study. Observed Frequencies Seeks Intensive…arrow_forward
- In a study of 301 Hispanic women living in San Antonia, Texas, one variable of interest was the percentage of subjects with impaired fasting glucose (IFG). IFG refers to a metabolic stage intermediate between normal glucose homeostasis and diabetes. In the study, 24 women were classified in the IFG stage. The article cites population estimates for IFG among Hispanic women in Texas as 6.3%. Is there sufficient evidence to indicate the population of Hispanic women in San Antonio has a prevalence of IFG higher than 6.3%? Use 95% confidence level and the p -value method to form your conclusion. The computed z score was 1.193. Find the p-value.arrow_forwardIn a study of 301 Hispanic women living in San Antonia, Texas, one variable of interest was the percentage of subjects with impaired fasting glucose (IFG). IFG refers to a metabolic stage intermediate between normal glucose homeostasis and diabetes. In the study, 24 women were classified in the IFG stage. The article cites population estimates for IFG among Hispanic women in Texas as 6.3%. Is there sufficient evidence to indicate the population of Hispanic women in San Antonio has a prevalence of IFG higher than 6.3%? Use 95% confidence level and the p -value method to form your conclusion. Answer the problem in a complete sentence.arrow_forwardIn a study of 301 Hispanic women living in San Antonia, Texas, one variable of interest was the percentage of subjects with impaired fasting glucose (IFG). IFG refers to a metabolic stage intermediate between normal glucose homeostasis and diabetes. In the study, 24 women were classified in the IFG stage. The article cites population estimates for IFG among Hispanic women in Texas as 6.3%. Is there sufficient evidence to indicate the population of Hispanic women in San Antonio has a prevalence of IFG higher than 6.3%? Use 95% confidence level and the p -value method to form your conclusion. Define x.arrow_forward
- Tim is interested in studying whether Cognitive Behavioural Therapy (CBT) is an effective treatment for Obsessive Compulsive Disorder (OCD). Six people who were diagnosed with OCD participated in Tim's study, where he recorded the number of times they washed their hands per day for one month. They were then given a three week intensive CBT program before their hand-washing was monitored for another month. The average number of times per day each participant washed their hands over the two months of observation are as follows: Participant Month 1 Month 2 1 11 6 2 8 5 3 14 17 4 10 10 5 22 11 6 15 10 Compute the appropriate statistic to determine whether the program was effective and use this information to fill in the blanks: Q1. revealed that the number of times per day participants washed their hands following the CBT program was Q2. compared to the number of times per day participants washed their hands before the…arrow_forwardVideo Games. A pathological video game user (PVGU) is a video game user that averages 31 or more hours a week of gameplay. According to the article “Pathological Video Game Use among Youths: A Two-Year Longitudinal Study” (Pediatrics, Vol. 127, No. 2, pp. 319–329) by D. Gentile et al., in 2011, about 9% of children in grades 3–8 were PVGUs. Suppose that, today, seven youths in grades 3–8 are randomly selected. a. Assuming that the percentage of PVGUs in grades 3–8 is the same today as it was in 2011, determine the probability distribution for the number, X, who are PVGUs. b. Determine and interpret the mean of X. c. If, in fact, exactly three of the seven youths selected are PVGUs, would you be inclined to conclude that the percentage of PVGUs in grades 3–8 has increased from the 2011 percentage? Explain your reasoning. Hint: First consider the probability P(X ≥ 3). d. If, in fact, exactly two of the seven youths selected are PVGUs, would you be inclined to conclude that the percentage…arrow_forwardA scientist is studying the effect of a new type of exercise program on cardiovascular health. The scientist randomly assigns individuals to either the exercise program or a control group. The scientist wants to determine if the exercise program has a statistically significant effect on cardiovascular health. The scientist monitors cardiovascular health by measuring the blood pressure of each individual.arrow_forward
 Linear Algebra: A Modern IntroductionAlgebraISBN:9781285463247Author:David PoolePublisher:Cengage Learning
 Calculus For The Life SciencesCalculusISBN:9780321964038Author:GREENWELL, Raymond N., RITCHEY, Nathan P., Lial, Margaret L.Publisher:Pearson Addison Wesley,
 Big Ideas Math A Bridge To Success Algebra 1: Stu...AlgebraISBN:9781680331141Author:HOUGHTON MIFFLIN HARCOURTPublisher:Houghton Mifflin Harcourt
 Glencoe Algebra 1, Student Edition, 9780079039897...AlgebraISBN:9780079039897Author:CarterPublisher:McGraw Hill