
Concept explainers
a)
To determine: The value of
Introduction: Control charts used to determine whether the process is under control or not. Attributes and variables are the factors under the control charts.
a)
Answer to Problem 10P
The value of
Explanation of Solution
Given information:
The following information is given:
Determine
The standard deviation of the sample means denoted by
Here,
σ refers to process standard deviation
n refers to the sample size.
The given values are
The standard deviation of the sample means
b)
To determine: The control limits for the mean chart if the value of z is 3.
Introduction: Control charts used to determine whether the process is under control or not. Attributes and variables are the factors under the control charts.
b)
Answer to Problem 10P
The UCL value of
Explanation of Solution
Given information:
The following information is given:
Sample size is given as 5 and process standard deviation is given as 1.36.
Determine the control limits for the mean chart if the value of z is 3:
Formulae to calculate control limits:
Here,
The value of
the standard deviation of the mean
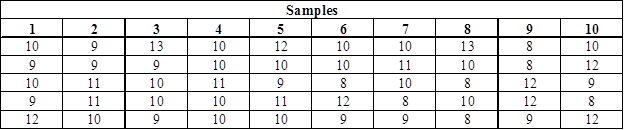
Calculate the average for each sample:
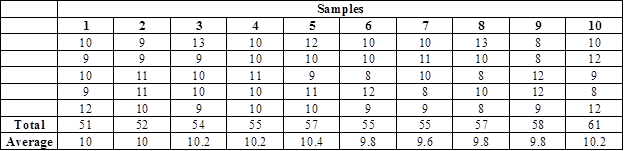
Working note:
Average for sample #1:
It is calculated by dividing the total of sample #1 and sample size.
Note: The same continues for all the samples.
Calculate the value of
It is calculated by dividing the sum of average of all the samples and the number of samples. Hence, the value of
Substitute the values in equation (1)to determine the value of UCL as follows:
Hence, the UCL value is 11.83.
Substitute the values in equation (2) to determine the value of LCL as follows:
Hence, the LCL value is 8.17.
c)
To determine: The control limits for the range chart.
Introduction: Control charts used to determine whether the process is under control or not. Attributes and variables are the factors under the control charts.
c)
Answer to Problem 10P
The UCL value of R-chart is 6.9795 and the LCL value is 0.
Explanation of Solution
Given information:
The following information is given:
Sample size is given as 5 and process standard deviation is given as 1.36.
Determine the control limits for the mean chart if the value of z is 3:
Formulae to calculate control limits:
Here,
Substitute the values in equation (3) to determine the value of UCL as follows:
Hence, the UCL value is 6.9795.
Substitute the values in equation (4) to determine the value of LCL as follows:
Hence, the LCL value is 0.
d)
To determine: Whether the process is in control.
Introduction: Control charts used to determine whether the process is under control or not. Attributes and variables are the factors under the control charts.
d)
Answer to Problem 10P
The process is in statistical control.
Explanation of Solution
Given information:
The following information is given:
Sample size is given as 5 and process standard deviation is given as 1.36.
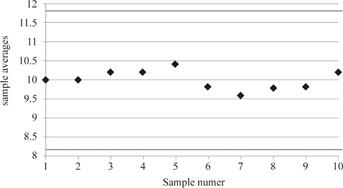
Plot the sample mean values in the
Plot the sample mean values in theR-control chart where
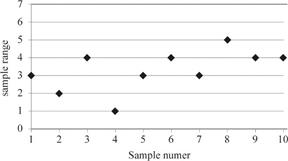
The sample range values lie well within the upper control limit and lower control limits.
The process is in statistical control.
Want to see more full solutions like this?
Chapter 6 Solutions
Principles Of Operations Management


- A quality inspector took five samples in five hours, each with four observations, of the length time for glue to dry. The analyst compute the mean of each sample and the computed the grand mean. All values are in minutes. Use this information to obtain three-sigma control limits for means. It is known from previous experience that the standard deviation of the process is 0.02 minutes. Draw a control chart Please provide a step-by-step solutionarrow_forwardThe overall average on a process you are attempting to monitor is 50 units. The process population standarddeviation is 1.72. Determine the upper and lower controllimits for a mean chart, if you choose to use a sample sizeof 5.a) Set z = 3.b) Now set z = 2. How do the control limits change?arrow_forwardA manager wishes to build a control chart for a process. A total of five () samples are collected with six (06) observations within each sample. The sample means (X-bar) are15.36, 14.61, 16.36, 20.28 , and 15.77 respectively. Also, the corresponding ranges are 0.79, 8.37, 4.81, 8.17 and 3.31 respectively. The lower and upper control limits of the x-bar chart are respectively aNone is correct b. 18.5513.47 , 11.47 d. 12.60.20.36 13.07 , 19.88arrow_forward
- Studies on a machine that molds plastic water pipe indicate that when it is injecting1-inch diameter pipe, the process standard deviation is 0.05 inches. The one-inchpipe has a specification of 1-inch plus or minus 0.10 inch. What is the processcapability index (Cp) if the long-run process mean is 1 inch?arrow_forward2. The overall average on a process you are attempting to monitor is 50.0 units. The process population standard deviation is 1.72. Sample size is given to be 4. Part 2 a) Determine the 3-sigma x-chart control limits. (UCLx)=Upper Control Limit _______ units (round your response to two decimal places). Lower Control Limit (LCL- ) = _____ units (round your response to two decimal places). How do the control limits change? A-The control limits for the 2 -sigma overbar x-chart and for the 3-sigma x -chart are the same B- The control limits are tighter for the 2-sigma overbar x -chart than for the 3-sigma x -chart. C- The control limits are tighter for the 3-sigma overbar x -chart than for the 2-sigma x -chart.arrow_forwardYour supervisor, Lisa Lehmann, has asked that you report on the output of a machine on the factory floor. This machine is supposed to be producing optical lenses with a meanweight of 50 grams and a range of 3.5 grams. The following table contains the data for a sample size of n = 6 taken during the past 3 hours: a) What are the :X-chart control limits when the machine is working properly?b) What are the R-charL control limits when the machine is working properly?c) What seems to be happening? (Hint: Graph the data points. Run charts may be helpful.)arrow_forward
- The overall average on a process you are attemptingto monitor is 50 units. The process population standard deviationis 1.72. Determine the upper and lower control limits for a meanchart, if you choose to use a sample size of 5. PXa) Set z = 3.b) Now set z = 2. How do the control limits change?arrow_forwardThe overall average of a process you are attemptingto monitor at Gihan Edirisinghe Motors is 75 units. The processstandard deviation is 1.95, and the sample size is 11 = 10. Whatwould be the upper and lower control limits for a 3-sigma controlchart?arrow_forwardAn automatic filling machine is used to fill 1-liter bottles of cola. The machine’s output is approximately normal with a mean of 1.0 liter and standard deviation of .01 liter. Output is monitored using means of samples of 25 observations. Determine upper and lower control limits that will include roughly 97% of the sample means when the process is in control. Using Appendix B, Table A to find the value of Z corresponding to the mean control limits.arrow_forward
- What trade-offs are involved in each of these decisions?a. Deciding whether to use two-sigma or three-sigma control limits.b. Choosing between a large sample size and a smaller sample size.c. Trying to increase the capability of a process that is barely capable.arrow_forwardA large national producer of cookies and baked goods uses a c chart to monitor the number of chocolate chips in its chocolate chip cookies. The company would like to have an average of six chips per cookie. One cookie is sampled each hour. The results of the last 12 hours were (given) a. Assuming a target value of c = 6, what are the upper and the lower control limits for a c chart?b. Are the 12 observations consistent with a target value of c = 6? If those 12 observations constitute a baseline, what upper and lower control limits result? (Use the normal approximation for your calculations.)arrow_forwardA process considered to be in control measures an ingredient in ounces. Roberto Baggio, a quality inspector took 20 samples, each with 8 observations as follows: thats in the pictuer after that using this information, obtain three-sigma (i.e., z=3) control limits for a mean control chart and control limits for a range chart, respectively. It is known from previous experience that the standard deviation of the process is 0.693. First: perform all actions and calculations needed to answer the question. All equations/calculations needed to be fully written STEP by STEP. No short calculations or direct answers/results will be accepted. This applies to the calculations for both types of control limits (mean and range). Second: Explain the process followed to identify each type of control limit and any observations made in the problem-solving process. thank you very mucharrow_forward
 Practical Management ScienceOperations ManagementISBN:9781337406659Author:WINSTON, Wayne L.Publisher:Cengage,
 Operations ManagementOperations ManagementISBN:9781259667473Author:William J StevensonPublisher:McGraw-Hill Education
 Operations and Supply Chain Management (Mcgraw-hi...Operations ManagementISBN:9781259666100Author:F. Robert Jacobs, Richard B ChasePublisher:McGraw-Hill Education
 Purchasing and Supply Chain ManagementOperations ManagementISBN:9781285869681Author:Robert M. Monczka, Robert B. Handfield, Larry C. Giunipero, James L. PattersonPublisher:Cengage Learning
 Production and Operations Analysis, Seventh Editi...Operations ManagementISBN:9781478623069Author:Steven Nahmias, Tava Lennon OlsenPublisher:Waveland Press, Inc.