
Concept explainers
a)
To determine: The value of control limits.
Introduction: Control charts used to determine whether the process is under control or not. Attributes and variables are the factors under the control charts.
a)
Answer to Problem 8P
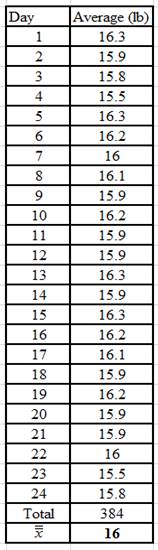
The value of control limits is 16.08 and 15.92.
Explanation of Solution
Given information:
The following information is given:

The mean of the sample means
Calculate
It is given that the population mean
Here, the sample size
Substitute the values of
Hence, the standard deviation of the means
Derive the values of upper control limits (UCL) and lower control limits (LCL):
Calculate UCL and LCL using the below formulae:
Here,
The value of
Compute the value of UCL by substituting in UCL formula, the values of
Hence, the upper control limit is
Compute the value of LCL by substituting in LCL formula, the values of
Hence, the lower control limit is
b)
To determine: The value of control limits.
Introduction: Control charts used to determine whether the process is under control or not. Attributes and variables are the factors under the control charts.
b)
Answer to Problem 8P
The value of control limits is 16.12 and 15.88.
Explanation of Solution
Given information:
The following information is given:
The mean of the sample means
Calculate
It is given that the population mean
Here, the sample size
Substitute the values of
Hence, the standard deviation of the means
Derive the values of upper control limits (UCL) and lower control limits (LCL):
Calculate UCL and LCL using the below formulae:
Here,
The value of
Compute the value of UCL by substituting in UCL formula, the values of
Hence, the upper control limit is
Compute the value of LCL by substituting in LCL formula, the values of
Hence, the lower control limit is
The control limits become wider when three standard deviations are used instead of two standard deviations. The process is now allowed wider latitude in terms of natural variations.
Want to see more full solutions like this?
Chapter 6 Solutions
Principles Of Operations Management


- At Gleditsia Triacanthos Company, a certain manufactured part is deemed acceptable if its length is between 12.45 to 12.55 inches. The process is normally distributed with an average of 12.49 inches and a standard deviation of 0.014 inches. a) is the process capable of meeting specifications? b) Does the process meet specifications?arrow_forwardOne of the stages in the process of making denim cloth at the Southern Mills Company is to spin cotton yarn onto spindles for subsequent use in the weaving process. Occasionally the yarn breaks during the spinning process, and an operator ties it back together. Some number of breaks is considered normal; however, too many breaks may mean that the yarn is of poor quality. In order to monitor this process, the quality-control manager randomly selects a spinning machine each hour and checks the number of breaks during a 15-minute period. Following is a summary of the observations for the past 20 hours. Construct a c-chart using 3 limits for this process and indicate if the process was out of control at any time.arrow_forwardResistors for electronic circuits are manufactured on a high-speed automated machine. The machine is set up to produce a large run of resistors of 1,000 ohms each. Use Exhibit 13.7. To set up the machine and to create a control chart to be used throughout the run, 15 samples were taken with four resistors in each sample. The complete list of samples and their measured values are as follows: Use three-sigma control limits. c. Determine the UCL and LCL for a X−X− chart. (Round your answers to 3 decimal places.) d. Determine the UCL and LCL for R-chart. (Leave no cells blank - be certain to enter "0" wherever required. Round your answers to 3 decimal places.)arrow_forward
- Designing an x -Chart Using the Process Standard DeviationThe Sunny Dale Bank monitors the time required to serve customers at the drive-through window because it is an important quality factor in competing with other banks in the city. After analyzing the data gathered in an extensive study of the window operation, bank management determined that the mean time to process a customer at the peak demand period is 5 minutes, with a standard deviation of 1.5 minutes. Management wants to monitor the mean time to process a customer by periodically using a sample size of six customers. Assume that the process variability is in statistical control. Design an x-chart that has a type I error of 5 percent. That is, set the control limits so that there is a 2.5 percent chance a sample result will fall below the LCL and a 2.5 percent chance that a sample result will fall above the UCL. After several weeks of sampling, two successive samples came in at 3.70 and 3.68 minutes, respectively. Is the…arrow_forwardRosters Chicken advertises " lite" chicken with 30% fewer calories than standard chicken. When the process for "lite" chicken breast production is in control, the average chicken breast contains 420 calories, and the standard deviation in caloric content of the chicken breast population is 25 calories. Rosters wants to design an x-chart to monitor the caloric content of chicken breasts, where 25 chicken breasts would be chosen at random to form each sample.a) What are the lower and upper control limits for th.is chart if these limits are chosen to be four standard deviations from the target?b) What a re the limits with three standard deviations from the target?arrow_forwardControl charts for X-bar and R, using a subgroup size of 5, are to be applied to control thecritical dimension of a certain manufacturing process. Specifications call for a nominal dimension of1,250.000 + 0.050 mm. The process is believed to have a σ of 0.015 mm Determine appropriate control limits for the X-bar and R charts. a) After 12 subgroups have been drawn and X-bar and R plotted on the charts, a computation of X-double bar give 1,250.015. b1) What is the probability that a value of X-bar will fall within the limits if this is the true value of the mean setting? b2) What is the probability that all 12values fall within the control limits? b) Make the necessary calculations to determine if the process can meet specifications by solvingfor Cp, Cpu, CpL, Cpk . Assume a normal distribution of product output. Illustrate how the processwould look like relative to the result of the computations of the process capability analysis.arrow_forward
- 3.1.The Great North Woods Clothing Company sells specialty outdoor clothing through its catalog. A quality problem that generates customer complaints occurs when a warehouse employee fills an order with the wrong items. The company has decided to implement a process control plan by inspecting the ordered items after they have been obtained from the warehouse and before they have been packaged. The company has taken 30 samples (during a 30-day period), each for 100 orders, and recorded the number of defective orders in each sample, as follows Sample Number of Defectives Sample Number of Defectives 1 12 16 6 2 14 17 3 3 10 18 7 4…arrow_forwardA process considered to be in control measures an ingredient in ounces. A quality inspector took 10 samples, each with 5 observations as follows: Using this information, obtain three-sigma (i.e., z=3) control limits for a mean control chart and control limits for a range chart, respectively. It is known from previous experience that the standard deviation of the process is 1.36. Discuss whether the process is in control or not.arrow_forwardA process considered to be in control measures an ingredient in ounces. A quality inspector took 10 samples, each with 5 observations as follows: SEE ATTACHED PHOTO Using this information, obtain three-sigma (i.e., z=3) control limits for a mean control chart and control limits for a range chart, respectively. It is known from previous experience that the standard deviation ofthe process is 1.36.arrow_forward
- A professor records the number of students who complain each week throughout the semester. If the class size is forty students, what are 3 - sigma control limits for this class? Construct a control chart and interpret the data. Week Complaints Number 1. 5 2. 2 3. 7 4. 1 5. 3 6. 2 7. 8 8. 1 9. 3 10. 5 11. 4 12. 6 13. 3 14. 1 15. 4arrow_forwardRefer to the table Factors for Computing Control Chart Limits (3 sigma) LOADING... for this problem. Your supervisor, Lisa Lehmann, has asked that you report on the output of a machine on the factory floor. This machine is supposed to be producing optical lenses with a mean weight of 50 grams and a range of 3.5 grams. The following table contains the data for a sample size of n=6 taken during the past 3 hours: Sample 1 2 3 4 5 6 7 8 9 10 x 55 47 49 50 52 57 55 48 51 56 R 3 1 5 3 2 6 3 2 2 3 Part 2 Set the control limits for this process for the x-chart when the machine is working properly. a) What are the x overbar-chart control limits when the machine is working properly? Calculate the upper control limit of the x overbar-chart Calculate the…arrow_forwardAt Gleditsia Triacanthos Company, a certain manufactured part is deemed acceptable if its lengthis between 12.45 to 12.55 inches. The process is normally distributed with an average of 12.49inches and a standard deviation of 0.014 inches. A) Is the process capable of meeting specifications? B) Does the process meet specifications?arrow_forward
 Practical Management ScienceOperations ManagementISBN:9781337406659Author:WINSTON, Wayne L.Publisher:Cengage,
 Operations ManagementOperations ManagementISBN:9781259667473Author:William J StevensonPublisher:McGraw-Hill Education
 Operations and Supply Chain Management (Mcgraw-hi...Operations ManagementISBN:9781259666100Author:F. Robert Jacobs, Richard B ChasePublisher:McGraw-Hill Education
 Purchasing and Supply Chain ManagementOperations ManagementISBN:9781285869681Author:Robert M. Monczka, Robert B. Handfield, Larry C. Giunipero, James L. PattersonPublisher:Cengage Learning
 Production and Operations Analysis, Seventh Editi...Operations ManagementISBN:9781478623069Author:Steven Nahmias, Tava Lennon OlsenPublisher:Waveland Press, Inc.