
Videos
The article “Chronic Beryllium Disease and Sensitization at a Beryllium Processing Facility” (K. Rosenman, V. Hertzberg, et al., Environmental Health Perspectives, 2005:1366–1372) discusses the effects of exposure to beryllium in a cohort of workers. Workers were categorized by their duration of exposure (in years) and by their disease status (chronic beryllium disease, sensitization to beryllium, or no disease). The results were as follows:
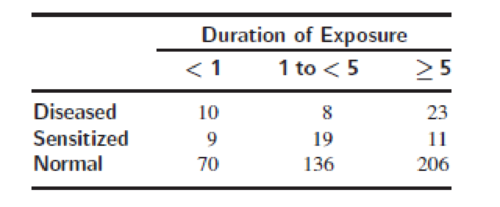
Can you conclude that the proportions of workers in the various disease categories differ among exposure levels?
Want to see the full answer?
Check out a sample textbook solution
Chapter 6 Solutions
Statistics for Engineers and Scientists
Additional Math Textbook Solutions
Developmental Mathematics (9th Edition)
Statistics for Psychology
Essentials of Statistics (6th Edition)
Elementary Statistics: A Step By Step Approach
Elementary Statistics ( 3rd International Edition ) Isbn:9781260092561
Elementary Statistics (13th Edition)


- Urban Travel Times Population of cities and driving times are related, as shown in the accompanying table, which shows the 1960 population N, in thousands, for several cities, together with the average time T, in minutes, sent by residents driving to work. City Population N Driving time T Los Angeles 6489 16.8 Pittsburgh 1804 12.6 Washington 1808 14.3 Hutchinson 38 6.1 Nashville 347 10.8 Tallahassee 48 7.3 An analysis of these data, along with data from 17 other cities in the United States and Canada, led to a power model of average driving time as a function of population. a Construct a power model of driving time in minutes as a function of population measured in thousands b Is average driving time in Pittsburgh more or less than would be expected from its population? c If you wish to move to a smaller city to reduce your average driving time to work by 25, how much smaller should the city be?arrow_forwardAmong the literature on quitting smoking are data detailing the relative successfulness of people of different ages in quitting smoking. A study of 400 adults who began various smoking-cessation programs produced the data in the table below. In the table, each participant is classified according to two variables: length of their smoking cessation period ("Less than two weeks", "Between two weeks and one year", or "At least one year") and age ("21-34", or "35 and over"). In the table, "less than two weeks" means that the individual returned to smoking within two weeks of beginning the program; "between two weeks and one year" means that the individual lasted the first two weeks without smoking but retuned to smoking within a year; and "at least one year" means that the individual has not smoked for at least a year since beginning the program. The table is a contingency table whose cells contain the respective observed frequencies of classifications of the 400 smokers. In addition, three…arrow_forwardAmong the literature on quitting smoking are data detailing the relative successfulness of people of different ages in quitting smoking. A study of 400 adults who began various smoking-cessation programs produced the data in the table below. In the table, each participant is classified according to two variables: length of their smoking cessation period ("Less than two weeks", "Between two weeks and one year", or "At least one year") and age ("21-34", or "35 and over"). In the table, "less than two weeks" means that the individual returned to smoking within two weeks of beginning the program; "between two weeks and one year" means that the individual lasted the first two weeks without smoking but retuned to smoking within a year; and "at least one year" means that the individual has not smoked for at least a year since beginning the program. The table is a contingency table whose cells contain the respective observed frequencies of classifications of the 400 smokers. In addition, three…arrow_forward
- In August and September 2005, Hurricanes Katrina and Rita caused extraordinary flooding in New Orleans, Louisiana. Many homes were severely damaged or destroyed; of those that survived, many required extensive cleaning. It was thought that cleaning flood-damaged homes might present a health hazard due to the large amounts of mold present in many of the homes. The article “Health Effects of Exposure to Water-Damaged New Orleans Homes Six Months After Hurricanes Katrina and Rita” (K. Cummings, J. Cox-Ganser, et al., American Journal of Public Health, 2008:869–875) reports that in a sample of 365 residents of Orleans Parish who had participated in the cleaning of one or more homes, 77 had experienced symptoms of wheezing, and in a sample of 179 residents who had not participated in cleaning, 23 reported wheezing symptoms (numbers read from a graph). Can you conclude that the frequency of wheezing symptoms is greater among those residents who participated in the cleaning of flood-damaged…arrow_forward2. A cohort study is conducted to assess the association between clinical characteristics and the risk of stroke. The study involves n = 1370 participants who are free of stroke at the study start. Each participant is assessed at study start (baseline) and every year thereafter for 5 years. The following data were collected relating hypertensive status measured at baseline to incident stroke over 5 years. Free of Stroke at 5 years Stroke Baseline: Not hypertensive 1000 50 Baseline: Hypertensive 300 50 Compute the cumulative incidence of stroke in patients classified as hypertensive at baseline.A)0.20B)0.50C)0.0625D)0.05arrow_forward1.“Effects of Short-Term Supplementation with Selenised Yeast on Milk Production and Composition of Lactating Cows”(Australian Journal of Dairy Technology, [2004]: 199-203) supplied the following data on milk selenium concentration (mg/L) for a sample of cows given seleniumsupplement (the treatment group) and a sample of cows given no supplement (the control group). The measurements of selenium were taken initally and again after a 9-day period. The study was conducted becausea deficiency of the trace element selenium in the diet can negatively impact growth, immunity, muscle and neuromuscular function, and fertility. The production of selenium supplements to dairy cows is justified when pastures have low selenium levels. data is attached a.Use the given data for the treatment group to determine if there is sufficient evidenceto conclude that the mean selenium concentration is greater after 9 days of the selenium supplement. b.Are the data for the cows in…arrow_forward
- Height and Breast Cancer. In the article “Height and Weight at Various Ages and Risk of Breast Cancer” (Annals of Epidemiology, Vol. 2, pp. 597–609), L. Brinton and C. Swanson discussed the relationship between height and breast cancer. The study, sponsored by the National Cancer Institute, took 5 years and involved more than 1500 women with breast cancer and 2000 women without breast cancer; it revealed a trend between height and breast cancer: “. . . taller women have a 50 to 80 percent greater risk of getting breast cancer than women who are closer to 5 feet tall.” Christine Swanson, a nutritionist who was involved with the study, added, “. . . height may be associated with the culprit, . . . but no one really knows” the exact relationship between height and the risk of breast cancer. a. Classify this study as either an observational study or a designed experiment. Explain your answer. b. Interpret the statement made by Christine Swanson in light of your answer to part (a).arrow_forwardSuppose a study investigated the effects of vitamin A, vitamin C, and omega-3 fatty acids supplements on improving eye health and vision. 300 adults volunteered to take part in the study. In the study, participants were randomly assigned to one of 3 different levels of Vitamin A (Level A, Level B, or Level C) and randomly assigned to one of 2 different levels of Vitamin C (Level 1 or Level 2) and randomly assigned to one of 2 different levels of omega-3 fatty acid (Level I or Level II). a. Identify the subjects of the study. b. Identify the factor(s) for the study and the number of treatment level(s) for each factor. c. How many different treatment groups are there in this study?arrow_forwardVideo Games. A pathological video game user (PVGU) is a video game user that averages 31 or more hours a week of gameplay. According to the article “Pathological Video Game Use among Youths: A Two-Year Longitudinal Study” (Pediatrics, Vol. 127, No. 2, pp. 319–329) by D. Gentile et al., in 2011, about 9% of children in grades 3–8 were PVGUs. Suppose that, today, seven youths in grades 3–8 are randomly selected. a. Assuming that the percentage of PVGUs in grades 3–8 is the same today as it was in 2011, determine the probability distribution for the number, X, who are PVGUs. b. Determine and interpret the mean of X. c. If, in fact, exactly three of the seven youths selected are PVGUs, would you be inclined to conclude that the percentage of PVGUs in grades 3–8 has increased from the 2011 percentage? Explain your reasoning. Hint: First consider the probability P(X ≥ 3). d. If, in fact, exactly two of the seven youths selected are PVGUs, would you be inclined to conclude that the percentage…arrow_forward
 Functions and Change: A Modeling Approach to Coll...AlgebraISBN:9781337111348Author:Bruce Crauder, Benny Evans, Alan NoellPublisher:Cengage Learning
 Calculus For The Life SciencesCalculusISBN:9780321964038Author:GREENWELL, Raymond N., RITCHEY, Nathan P., Lial, Margaret L.Publisher:Pearson Addison Wesley,