Concepts of Genetics (12th Edition)
12th Edition
ISBN: 9780134604718
Author: William S. Klug, Michael R. Cummings, Charlotte A. Spencer, Michael A. Palladino, Darrell Killian
Publisher: PEARSON
expand_more
expand_more
format_list_bulleted
Videos
Textbook Question
Chapter 25, Problem 11PDQ
Corn plants from a test plot are measured, and the distribution of heights at 10-cm intervals is recorded in the following table:
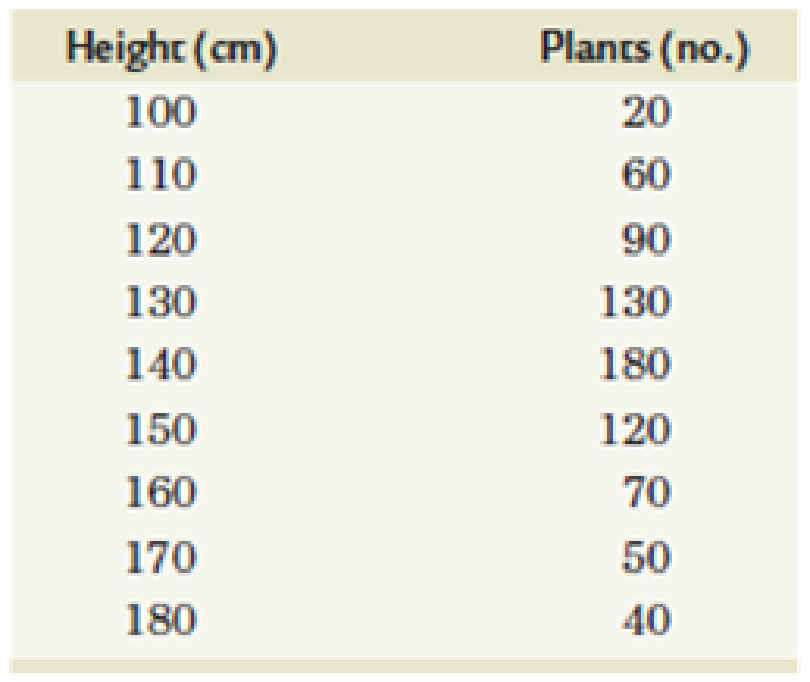
Calculate (a) the mean height, (b) the variance, (c) the standard deviation, and (d) the standard error of the mean. Plot a rough graph of plant height against frequency. Do the values represent a normal distribution? Based on your calculations, how would you assess the variation within this population?
Expert Solution & Answer
Want to see the full answer?
Check out a sample textbook solution
Students have asked these similar questions
The phenotypic data below are the shoot lengths of 25 F1 and 25 F2 rice plants at seedling stage, produced from the cross of IR29 and Hasawi rice varieties. The mean lengths of the shoot from IR29 and Hasawi are 23.1 cm and 46.7 cm, respectively. Tabulate and plot the frequency distributions of the F1 and F2 generations. Use the formulas below in the computations. From each distribution calculate the mean, the variance, and the standard error of the mean. Round off answers to two decimal places. What is the main difference between F1 and F2 distributions?
How are the standard deviation and variance related to each other?
How are they different than just measuring the range?
Can plot samples of dandelion cover from two different locations have the same mean but different variance? Explain.
Can you answer question 3? Thanks.
The phenotypic data below are the shoot lengths of 25 F1 and 25 F2 rice plants atseedling stage, produced from the cross of IR29 and Hasawi rice varieties. The mean lengths of the shoot from IR29 and Hasawi are 23.1 cm and 46.7 cm, respectively. Tabulate and plot the frequency distributions of the F1 and F2 generations. From each distribution calculate the mean, the variance,and the standard error of the mean. What is the main difference between F1 and F2 distributions?
Formulas needed:Range (R) = maximum – minimum (Use the same no. of decimal places as original data.)No. of phenotypic classes (K) = 1 + 3.3logn (Round up answer to an integer. Number may still be increased or decreased as needed.)n = total no. of valuesClass interval (CI) = R/K (Use the same no. of decimal places as original data.)
Chapter 25 Solutions
Concepts of Genetics (12th Edition)
Ch. 25 - A homozygous plant with 20-cm-diameter flowers is...Ch. 25 - The following table shows measurements for fiber...Ch. 25 - The following cable gives the percentage of twin...Ch. 25 - At an interview with a genetic counselor, a couple...Ch. 25 - Prob. 2CSCh. 25 - At an interview with a genetic counselor, a couple...Ch. 25 - HOW DO WE KNOW? In this chapter, we focused on a...Ch. 25 - CONCEPT QUESTION Review the Chapter Concepts list...Ch. 25 - Define the following: (a) polygenic, (b) additive...Ch. 25 - A dark-red strain and a white strain of wheat are...
Ch. 25 - Height in humans depends on the additive action of...Ch. 25 - An inbred strain of plants has a mean height of 24...Ch. 25 - Erma and Harvey were a compatible barnyard pair,...Ch. 25 - In the following table, average differences of...Ch. 25 - What kind of heritability estimates (broad sense...Ch. 25 - List as many human traits as you can that are...Ch. 25 - Corn plants from a test plot are measured, and the...Ch. 25 - The following variances were calculated for two...Ch. 25 - The mean and variance of plant height of two...Ch. 25 - Prob. 14PDQCh. 25 - Prob. 15PDQCh. 25 - In an assessment of learning in Drosophila, flies...Ch. 25 - Prob. 17PDQCh. 25 - Prob. 18PDQCh. 25 - In a population of 100 inbred, genotypically...Ch. 25 - Many traits of economic or medical significance...Ch. 25 - A 3-inch plant was crossed with a 15-inch plant,...Ch. 25 - In a cross between a strain of large guinea pigs...Ch. 25 - Type A1B brachydactyly (short middle phalanges) is...Ch. 25 - In a series of crosses between two true-breeding...Ch. 25 - Students in a genetics laboratory began an...Ch. 25 - Prob. 26ESPCh. 25 - Canine hip dysplasia is a quantitative trait that...Ch. 25 - Floral traits in plants often play key roles in...Ch. 25 - In 1988, Horst Wilkens investigated blind...
Knowledge Booster


Learn more about
Need a deep-dive on the concept behind this application? Look no further. Learn more about this topic, biology and related others by exploring similar questions and additional content below.Similar questions
- What does P-value indicate? In statistical analysis the results for two sets of data are presented with P < 0.01 and P<0.005. What does it mean?arrow_forwardCalculate the Variance of the following data set: 10, 15, 13, 12, 14arrow_forwardUsing the data and the graph in the picture, do a chi-square and its statistical analysis?arrow_forward
- Describe in your own words what variance measures. Then explain why the variance of both samples must be used in the calculation of a t-test (In other words, explain why we have to factor in the variance when comparing the means).arrow_forwardIn a Lineweaver-burk plot, the Y-intercept is -1/KM True or Falsearrow_forwardThe heights of mothers and daughters are given in the following table: Height of mother (in) Height of daughter (in) 64 66 65 66 66 68 64 65 63 65 63 62 59 62 62 64 61 63 60 62 a. Calculate the correlation coefficient for the heights of the mothers and daughters. b. Using regression, predict the expected height of a daughter whose mother is 67 inches tall.arrow_forward
- Upon comparing the mass of Fuji apples grown on two farms in Georgetown, KY--one using organic fertilizer and a neighboring farm using commercial fertilizer, the a research program commissioned by the USDA finds that the mean mass of organically and commercially grown apples are 224.2 g and 224.6 g, respectively. The standard error for both means is 0.015 g. The statistical test obtained by comparing the mass of several thousand apples from each farm (organic: 6,000, commercial: 78,000) produced a p-value of 0.001. What is correct interpretation of the results? The apples from the non-organic apples tend to be heavier than organic apples. There is no discernible difference in the mass of apples grown on both farm; this is supported by the statistically significant P-vale of 0.001. O Apples from the commercial farm were heavier than those from the organic farm, and this difference is statistically significant. O The difference in mass of apples from the two farms is negligible.arrow_forwardDraw both the Michaelis-Menton and Linweaver-Burke plots. Labe Km vmax and 1/2 vMax where applicable. Indicate how changes in the x-intercept and y-intercept of the line-weaver burke plot affects km and vmaxarrow_forwardSuppose we have the following table in our goodness of fit test results: Variable/Condition Value p-value 0.077 Significance level 0.05 Conclusion then what do we write in the cell corresponding to "Conclusion"? Suppose we have the following table in our goodness of fit test results: Variable/Condition Value p-value 0.077 Significance level 0.05 Conclusion then what do we write in the cell corresponding to "Conclusion"? We change the significance level to 0.95. We accept the null hypothesis that the disease possibly follows the specified mode of inheritance at the given gene. We reject the null hypothesis that the disease possibly follows the specified mode of inheritance at the given gene. We accept the null hypothesis that the disease almost certainly follows the specified mode of inheritance at the given gene. We collect more data.arrow_forward
- If n ≥ 100, you may use normal distribution in all cases. please do it with excel formulas.arrow_forwardThe mean and standard deviation of plant height from two rice plants (P1 and P2) and their progeny (F1 and F2) and a backcross generation (P1 x F1) are shown below. Complete the table by calculating the variances and coefficient of variation for each population and answer the questionswhich follow (See image) 1. Explain the possible reasons for the observed differences in the sample means. Account forthe differences in the sample means of P1 and P2. Similarly, account for the differences in thesample means of the F1 and F2. Compare the difference in the parental generations with thatin the filial generations.2. Interpret the CV values from each population.3. Compare the sample variances of P1 and P2. Account for any differences. Similarly, comparethe sample variances of the F1 and F2 generations, and account for any differences. Give thepossible causes of variation in each generation.4. Calculate the broad-sense heritability of plant height in this species. Interpret your results.arrow_forwardWhy is it difficult to accurately estimate Km and Vmax values from a Michaelis-Menten plot? Why are the benefits of estimating Km and Vmax values from a Lineweaver-Burk plotarrow_forward
arrow_back_ios
SEE MORE QUESTIONS
arrow_forward_ios
Recommended textbooks for you

Introduction to the NIOSH Manual of Analytical Methods Fifth edition; Author: Centers for Disease Control and Prevention (CDC);https://www.youtube.com/watch?v=B5rUrKLMoas;License: Standard Youtube License