
Concept explainers
Videos
To review:
Calculate the average per-site, per-generation, nonsynonymous substitution rate between D. ananassae and the other three species. Also, give inputs about the type of selection of operating on the nonsynonymous sites based on the difference between the rate calculated in this part and question 1.
Given:
In the given study, a hypothetical gene encodes for the transcription factors in various species of Drosophila. According to the diagram given below, one exon of this gene is sequenced in four species.
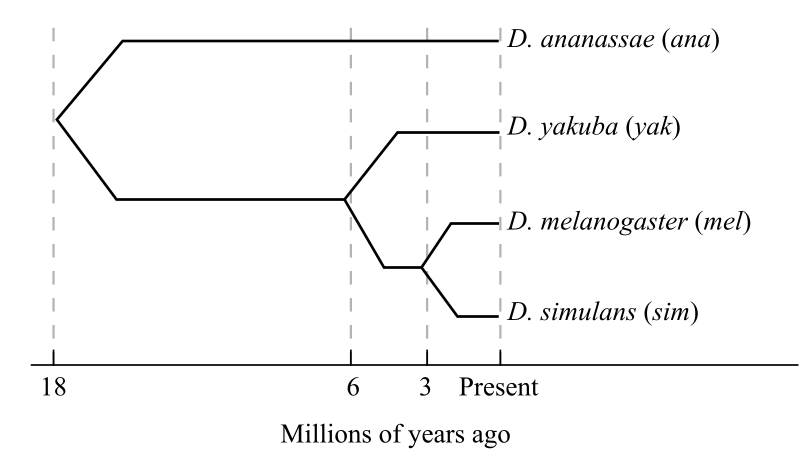
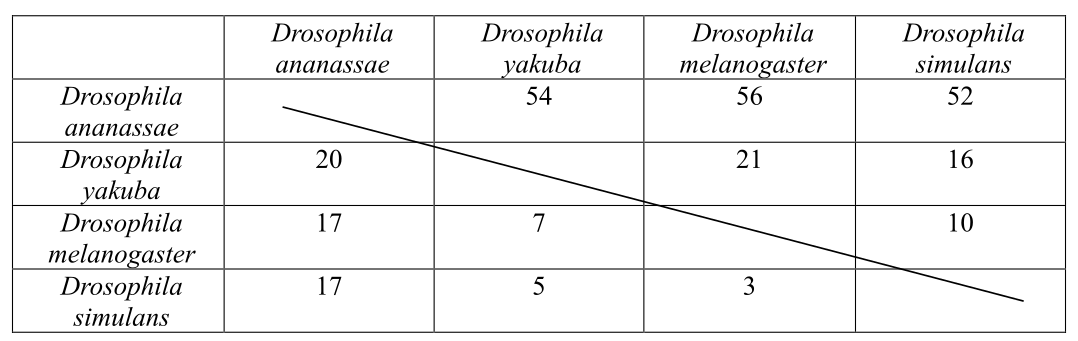
The matrix shows the number of synonymous and nonsynonymous substitutions between pairs of species of Drosophila, which evolved as a result of evolution. There are 2000 nonsynonymous and 600 synonymous substitutions sites of the exon.
Introduction:
The mutation rate is the rate used to calculate the frequency of new mutation in a single gene or one single organism, which have evolved over the time. The substitution rate is the rate which checks the DNA (deoxyribonucleic acid) sequence as the number of
Want to see the full answer?
Check out a sample textbook solution
Chapter 23 Solutions
Life: The Science of Biology


- Schizosaccharomyces pombe, also known as "fission yeast," is a powerful model organism in molecular and cell biology. While performing a genetic screen, you discover an auxotrophic S. pombe strain that is unable to synthesize one or more vitamins. The following table represents the key experiments you performed during your genetic screen. Fill in the table with the outcome of each experiment for your mutant strain (using + for growth and - for no growth). Medium Rich media Minimal media Minimal media + all vitamins Minimal media + all amino acids Growth Wild-type + + + + Mutant + + + > > >arrow_forwardIf we say that a certain STR locus has “high heterozygosity” in the human population, what do wemean and why is this good for forensic analysis?arrow_forwardExplain how the technique of replica plating supports the randommutation theory but conflicts with the physiological adaptationhypothesis.arrow_forward
- A shuttle vector is a vector constructed so that it can propagate in two different host species. One of the most common types of shuttle vectors is the yeast shuttle vector. (1) Name the THREE (3) most common yeast shuttle vectors. (ii) Based on the answer above, differentiate these THREE (3) vectors.arrow_forwardDNA from a strain of Bacillus subtilis with the genotype trp+ tyr+ was used to transform a recipient strain with the genotype trp− tyr−. The following numbers of transformed cells were recovered: Genotype Number of transformed cells trp+ tyr− 154 trp− tyr+ 312 trp+ tyr+ 354 What do these results suggest about the linkage of the trp and tyr genes?arrow_forwardIn DNA-hybridization experiments on six species of plants in the genus Vicia, DNA was isolated from each of the six species, denatured by heating, and sheared into small fragments (W. Y. Chooi. 1971. Genetics 68:213–230). In one experiment, DNA from each species and from E. coli was allowed to renature. The graph shows the results of this renaturation experiment. Q. Can you explain why the E. coli DNA renatures at a much faster rate than does DNA from any of the Vicia species?arrow_forward
- Recombinant protein production by a genetically modified Escherichia coli strain is proportional to cell growth. Ammonia is used as a nitrogen source for aerobic glucose respiration. The recombinant protein has the general formula CH1,55O0,31N0,25, while that of the cellular biomass is CH1,77O0,49N0,24. The biomass yield from glucose equals 0.50 g/g, while the recombinant protein yield from glucose corresponds to 20% of the cell yield from substrate.a) How much ammonia is required? What is the oxygen demand? (b) If the biomass yield remains the same, what are the ammonia and oxygen requirements for a wild-type strain of E. coli, with cell biomass of the same elemental composition, but unable to synthesize the recombinant protein? (c) On an industrial scale, cultivation takes place in a continuous fermenter at 28°C and the desired recombinant protein production rate is 7 g/h. Since the viscosity of the culture broth is considerable, the energy input due to agitation cannot be neglected.…arrow_forwardWhen an Avidian (with a genome size of 50 sites) reproduces with a 10% per site mutation rate, and if the number of mutations per genome is Poisson distributed, then what is the most likely outcome? Possible answers: 4 per genome is most likely, 5 per genome is most likely, 4 mutations per genome and 5 mutations per genome are equally likely, A number other than 4 and/or 5 mutations per genome is most likelyarrow_forward. An Hfr+ strain is used to map three genes: ala, leu, and thr in an interrupted mating experiment. Hfr/ala+, leu+, thr+, camS x F-/ala-, leu-, thr-, camR The cross is initiated at time = 0, and at various times, the mating mixture is plated on three types of medium. Each plate contains minimal medium with chloramphenicol and the amino acids as listed in the table. The data represents the number of colonies growing on each plate. Time of interruption Nutrients added 5 min 10 min 15 min 20 min alanine, leucine 8 21 58 85 leucine, threonine 0 3 19 46 alanine, threonine 0 0 7 16 Based on these data, what is the order of gene transfer relative to one another and to the F-factor.arrow_forward
- suggest a strategy that you might employ to isolate all of the genes involved in nitrogen fixation from Azobacter vinelandi assuming that you do not have nif genes from other microorganisms to use as hybridization probes and discuss whether it is possible to genetically engineer plants to fix nitrogen.arrow_forwardIn DNA-hybridization experiments on six species of plants in the genus Vicia, DNA was isolated from each of the six species, denatured by heating, and sheared into small fragments (W. Y. Chooi. 1971. Genetics 68:213–230). In one experiment, DNA from each species and from E. coli was allowed to renature. The graph shows the results of this renaturation experiment. Q. Notice that, for the Vicia species, the rate of renaturation is much faster in the first hour and then slows down. What might cause this initial rapid renaturation and the subsequent slowdown?arrow_forwardFour Hfr strains are derived from an F+ strain of E. Coli to serve as donors for an interrupted-mating experiment. Use the time-table and partial map of the F+ strain (shown below) to determine the genes’ respective positions. Keep in mind that the map distances are NOT proportional, only the FIRST 5 markers are indicated per strain, and the entry times, recorded in minutes, are in parentheses. Transferred genes represent wild-type alleles. Based on the data, which gene can be located at position 5 on the map?arrow_forward
 Biology: The Dynamic Science (MindTap Course List)BiologyISBN:9781305389892Author:Peter J. Russell, Paul E. Hertz, Beverly McMillanPublisher:Cengage Learning