
Concept explainers
Videos
(a)
To find: the shape, center, and spread of the distribution of density measurements.
(a)
Answer to Problem 64E
Shape: the distribution is roughly symmetric
The center 5.4479 (mean) or 5.46(
Spread: 0.2209 (standard deviation)
Explanation of Solution
Given:
| 5.50 | 5.61 | 4.88 | 5.07 | 5.26 | 5.55 | 5.36 | 5.29 | 5.58 | 5.65 |
| 5.57 | 5.53 | 5.62 | 5.29 | 5.44 | 5.34 | 5.79 | 5.10 | 5.27 | 5.39 |
| 5.42 | 5.47 | 5.63 | 5.34 | 5.46 | 5.30 | 5.75 | 5.68 | 5.85 |
Calculation:
Descriptive Statistics: earth density
| Variable | Mean | StDev | Minimum | Q1 | Median | Q3 | Maximum |
| earth density | 5.4479 | 0.2209 | 4.8800 | 5.2950 | 5.4600 | 5.6150 | 5.8500 |
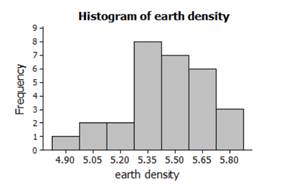
The measurements of the earth's density are roughly symmetric with a mean of 5.45 and vary from 4.88 to 5.85.
Shape: the distribution is roughly symmetric (part of the graph is a rough mirror image of the other part of the graph.)
The center is about 5.4479 (mean) or 5.46(median)
Spread is about 0.2209 (standard deviation)
Conclusion:
Therefore,
Shape: the distribution is roughly symmetric
The center 5.4479 (mean) or 5.46(median)
Spread: 0.2209 (standard deviation)
(b)
To find: the percent of observations that fall within one, two, and three standard deviations of the mean
(b)
Answer to Problem 64E
One standard deviations =
Two standard deviations = 96.55%
Three standard deviations = 100%
Explanation of Solution
The densities follow the
Conclusion:
Therefore,
One standard deviations =
Two standard deviations = 96.55%
Three standard deviations = 100%
(b)
To find: To construct: a Normal
(b)
Answer to Problem 64E
Explanation of Solution
Calculation:
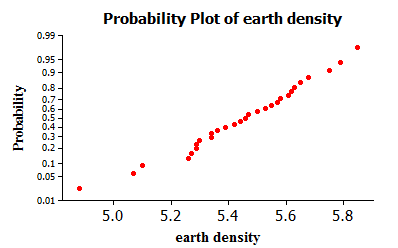
A Normal probability plot from Minitab is shown below:

The Normal probability plot is roughly linear, indicating that the densities are approximately Normal.
Conclusion:
Therefore, a Normal probability plot is plotted.
(b)
To explain: whether the data are approximately Normal
(b)
Answer to Problem 64E
the data are approximately Normal
Explanation of Solution
Calculation:
The graphical display in (A), check of the 68-95-99.7 rule in (B), and Normal probability plot in (C) indicate that these measurements are approximately Normal.
Conclusion:
Normal probability plot in (C) indicate that these measurements are approximately Normal.
Chapter 2 Solutions
The Practice of Statistics for AP - 4th Edition
Additional Math Textbook Solutions
College Algebra (7th Edition)
University Calculus: Early Transcendentals (4th Edition)
Calculus: Early Transcendentals (2nd Edition)
Basic Business Statistics, Student Value Edition
A First Course in Probability (10th Edition)
Algebra and Trigonometry (6th Edition)


 MATLAB: An Introduction with ApplicationsStatisticsISBN:9781119256830Author:Amos GilatPublisher:John Wiley & Sons Inc
 Probability and Statistics for Engineering and th...StatisticsISBN:9781305251809Author:Jay L. DevorePublisher:Cengage Learning
 Statistics for The Behavioral Sciences (MindTap C...StatisticsISBN:9781305504912Author:Frederick J Gravetter, Larry B. WallnauPublisher:Cengage Learning
 Elementary Statistics: Picturing the World (7th E...StatisticsISBN:9780134683416Author:Ron Larson, Betsy FarberPublisher:PEARSON
 The Basic Practice of StatisticsStatisticsISBN:9781319042578Author:David S. Moore, William I. Notz, Michael A. FlignerPublisher:W. H. Freeman
 Introduction to the Practice of StatisticsStatisticsISBN:9781319013387Author:David S. Moore, George P. McCabe, Bruce A. CraigPublisher:W. H. Freeman