
Concept explainers
Videos
(a)
To find: the percentile is a pregnancy that lasts 240 days
(a)
Answer to Problem 53E
The proportion of pregnancies is lasting less than 240 days.
Explanation of Solution
Given:
Mean is 266 days
Standard deviation is 16 days.
Calculation:
For the given information,
State: Let x be a random variable defined as length of pregnancies. We want the proportionof pregnancies that last less than 240 days.
Plan: The proportion of pregnancies lasting less than 240 days.
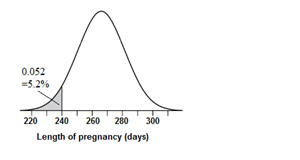
Do: For x =240, we find the corresponding z value as follows:
Therefore, the area below 240 is equal to the area below -1.63 in z-scale.
Using standard normal table, we can see that the proportion of observations below -1.63 is
0.0516 That is about 5.2%
Conclude: About 5.2% of pregnancies last less than 240 days.
Conclusion:
Therefore, About 5.2% of pregnancies last less than 240 days.
(b)
To find:the percent of pregnancies which last between 240 and 270 days
(b)
Answer to Problem 53E
Approximately 55% of pregnancies last between 240 and 270 days.
Explanation of Solution
Calculation:
Let x be a random variable defined as length of pregnancies. We want the proportion of pregnancies lasting between 240 and 270 days.
Plan: The proportion of pregnancies lasting between 240 and 270 days.
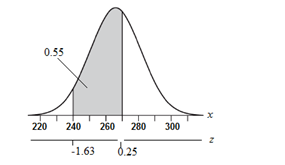
Do: From part (a), we have seen that for x = 240, z = -1.63.
For, x = 270, we can calculate the z value as follows:
From the standard normal table, the z value corresponding to 0.25 is 0.5987. Also, from part (a), the z value corresponding to -1.63 is 0.052. Therefore, the proportion of observations between
-1.63 and 0.25 is given by
0.5987 − 0.0516 = 0.5471
Approximately 55% of pregnancies last between 240 and 270 days.
Conclusion:
Therefore, 55% of pregnancies last between 240 and 270 days.
(c)
To find: the number of days that 20% of pregnancies last
(c)
Answer to Problem 53E
The longest 20% of pregnancies last approximately 279 or more days.
Explanation of Solution
Calculation:
Let x be a random variable defined as length of pregnancies. We want the number ofdays such that 80% of people have shorter pregnancies than that number of days.
Plan: The 80th percentile for the length of human pregnancy is shown in the graph below
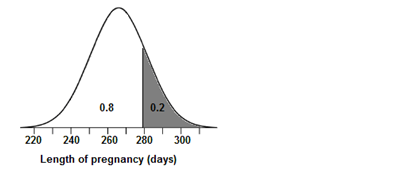
Do: From standard normal table, the value of z corresponding to 0.80 is 0.84. Therefore, the
80th percentile for the length of human pregnancy can be found by solving the equation:
Conclude: The longest 20% of pregnancies last approximately 279 or more days.
Conclusion:
Therefore, the longest 20% of pregnancies last approximately 279 or more days.
Chapter 2 Solutions
The Practice of Statistics for AP - 4th Edition
Additional Math Textbook Solutions
Elementary Statistics: Picturing the World (6th Edition)
Statistics for Business and Economics (13th Edition)
Elementary Statistics
Introductory Statistics (2nd Edition)
Basic Business Statistics, Student Value Edition


 MATLAB: An Introduction with ApplicationsStatisticsISBN:9781119256830Author:Amos GilatPublisher:John Wiley & Sons Inc
 Probability and Statistics for Engineering and th...StatisticsISBN:9781305251809Author:Jay L. DevorePublisher:Cengage Learning
 Statistics for The Behavioral Sciences (MindTap C...StatisticsISBN:9781305504912Author:Frederick J Gravetter, Larry B. WallnauPublisher:Cengage Learning
 Elementary Statistics: Picturing the World (7th E...StatisticsISBN:9780134683416Author:Ron Larson, Betsy FarberPublisher:PEARSON
 The Basic Practice of StatisticsStatisticsISBN:9781319042578Author:David S. Moore, William I. Notz, Michael A. FlignerPublisher:W. H. Freeman
 Introduction to the Practice of StatisticsStatisticsISBN:9781319013387Author:David S. Moore, George P. McCabe, Bruce A. CraigPublisher:W. H. Freeman