
Concept explainers
Videos
(a)
To find: the proportion of observations from a standard Normal distribution
(a)
Answer to Problem 7CRE
Hence, there exists
Explanation of Solution
Given:
Calculation:
The given region is shown in the following graph as follows:
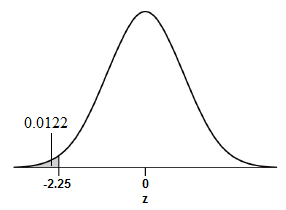
From standard normal table, the value below -2.25 is 0.0122
Hence, there exists
Conclusion:
Hence, there exists
(b)
To find: the proportion of observations from a standard Normal distribution
(b)
Answer to Problem 7CRE
The proportion of observation is
Explanation of Solution
Given:
Calculation:
Find the proportion of observations from Standard Normal distribution for the region
The given region is shown in the following graph as follows.

From part (a), the area below the value -2.25 is 0.0122
Then, the proportion of observations larger than -2.25 is calculated as follows.
=Total Proportion- proportion of observations before -2.25
Conclusion:
The proportion of observation is
(c)
To find: the proportion of observations from a standard Normal distribution
(c)
Answer to Problem 7CRE
Hence,
Explanation of Solution
Given:
Calculation:
Find the proportion of observations from Standard Normal distribution for the region
The given region is shown in the following graph as follows.
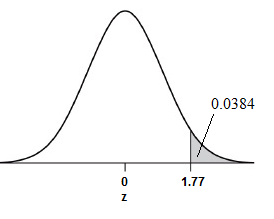
Using Standard Normal tables, the area before 1.77 is 0.9616. Therefore, the proportion of observations below 1.77 is 0.9616
Then, the proportion of observations greater than 1.77 is the value of proportion less than 1.77subtracted from 1 (total of the proportion)
That is, the proportion of observations greater than 1.77
Hence,
Conclusion:
Hence,
(d)
To find: the proportion of observations from a standard Normal distribution
(d)
Answer to Problem 7CRE
Hence,
Explanation of Solution
Given:
Calculation:
Find the proportion of observations from Standard Normal distribution for the region
The given region is shown in the following graph as follows:
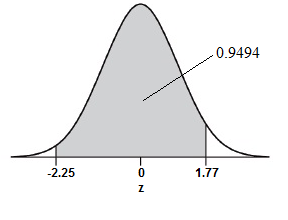
The required region can be obtained by subtracting the area before -225 from the area before
1.77
From part (a), the area before -2.25 is 0.0122. Also, the area before 1.77 is 0.9616 (from
Standard Normal tables)
Then, the area between -2.25 and 1.77 is
Hence,
Conclusion:
Hence,
Chapter 2 Solutions
The Practice of Statistics for AP - 4th Edition
Additional Math Textbook Solutions
Elementary Statistics: Picturing the World (6th Edition)
STATS:DATA+MODELS-W/DVD
Essentials of Statistics, Books a la Carte Edition (5th Edition)
Introductory Statistics (10th Edition)
Elementary Statistics: Picturing the World (7th Edition)
Elementary Statistics Using Excel (6th Edition)


 MATLAB: An Introduction with ApplicationsStatisticsISBN:9781119256830Author:Amos GilatPublisher:John Wiley & Sons Inc
 Probability and Statistics for Engineering and th...StatisticsISBN:9781305251809Author:Jay L. DevorePublisher:Cengage Learning
 Statistics for The Behavioral Sciences (MindTap C...StatisticsISBN:9781305504912Author:Frederick J Gravetter, Larry B. WallnauPublisher:Cengage Learning
 Elementary Statistics: Picturing the World (7th E...StatisticsISBN:9780134683416Author:Ron Larson, Betsy FarberPublisher:PEARSON
 The Basic Practice of StatisticsStatisticsISBN:9781319042578Author:David S. Moore, William I. Notz, Michael A. FlignerPublisher:W. H. Freeman
 Introduction to the Practice of StatisticsStatisticsISBN:9781319013387Author:David S. Moore, George P. McCabe, Bruce A. CraigPublisher:W. H. Freeman