
Videos
(a)
To estimate: the
(a)
Answer to Problem 9E
The Inter-
Explanation of Solution
Given:
Calculation:
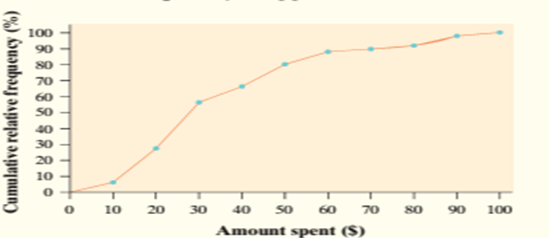
The figure below is a cumulative relative frequency graph of the amount spent by 50consecutive grocery shoppers at a store.
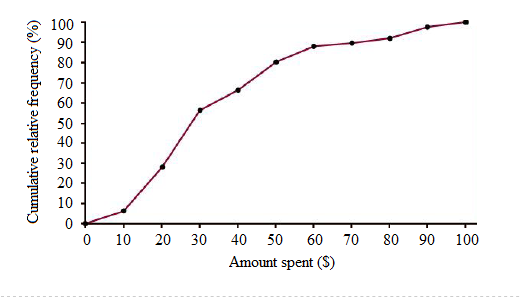
We are supposed to find the Inter-Quartile range of the amount spent by 50 consecutive grocery shoppers at a store basing on the above cumulative relative frequency graph.
Inter-Quartile range is defined as follows:
Where
Procedure to find the quartiles is given as follows:
Step1: Draw a horizontal line from the value 25 on the vertical axis and determine the point onthe ogive where the line intersects the ogive.
Step2: Draw a vertical line from this point to the horizontal axis. The line intersects the axis atapproximately $19
Thus, $19 is the estimate of the
Step3: Draw a horizontal line from the value 75 on the vertical axis and determine the point onthe ogive where the line intersects the ogive.
Step4: Draw a vertical line from this point to the horizontal axis. The line intersects the axis at approximately $46
Thus, $46is the estimate of the
The following graph shows the above procedure:
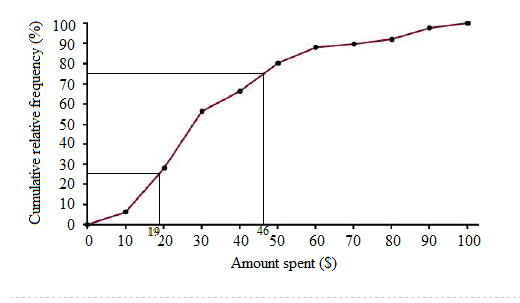
Hence, the Inter-Quartile range is calculated as follows:
Therefore, the Inter-Quartile range of the amount spent by 50 consecutive grocery shoppers at a store is $27.
Conclusion:
Therefore, the Inter-Quartile range is $27.
(b)
To find: the percentile for the shopper who spent $19.50
(b)
Answer to Problem 9E
Here, $19.50 is at about the
Explanation of Solution
Calculation:
From the above figure we can clearly see that shopper who spent $19.50 is just above the
Conclusion:
Hence, $19.50 is at about the
(c)
To draw: the histogram that correspondsto the given graph
(c)
Answer to Problem 9E

Explanation of Solution
Calculation:
From the above cumulative graph, we find the cumulative frequencies corresponding todifferent mid values.
From the cumulative graph, the obtained cumulative frequencies are 5,25,55,62,80,87,88 90,96,98 corresponding to mid values 10,20,30,40,50,60,70,80,90,100 .The corresponding frequencies are obtained as 5,20,30,7,18,7,1,2,6,2
Using frequencies, we construct histogram for the given data. The obtained graph is as follows:
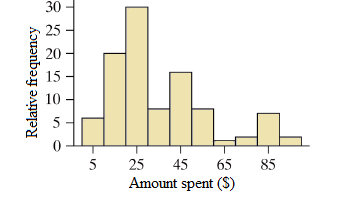
From the above histogram, we can see that the data of the amount spent by 50 consecutivegrocery shoppers at a store is spread towards right side. Hence, we can say that the abovedata is skewed towards right.
Conclusion:
Therefore, the histogram is drawn.
Chapter 2 Solutions
The Practice of Statistics for AP - 4th Edition
Additional Math Textbook Solutions
Fundamentals of Statistics (5th Edition)
Statistics: The Art and Science of Learning from Data (4th Edition)
Elementary Statistics: Picturing the World (7th Edition)
Introductory Statistics
Basic Business Statistics, Student Value Edition
Introductory Statistics (2nd Edition)


 MATLAB: An Introduction with ApplicationsStatisticsISBN:9781119256830Author:Amos GilatPublisher:John Wiley & Sons Inc
 Probability and Statistics for Engineering and th...StatisticsISBN:9781305251809Author:Jay L. DevorePublisher:Cengage Learning
 Statistics for The Behavioral Sciences (MindTap C...StatisticsISBN:9781305504912Author:Frederick J Gravetter, Larry B. WallnauPublisher:Cengage Learning
 Elementary Statistics: Picturing the World (7th E...StatisticsISBN:9780134683416Author:Ron Larson, Betsy FarberPublisher:PEARSON
 The Basic Practice of StatisticsStatisticsISBN:9781319042578Author:David S. Moore, William I. Notz, Michael A. FlignerPublisher:W. H. Freeman
 Introduction to the Practice of StatisticsStatisticsISBN:9781319013387Author:David S. Moore, George P. McCabe, Bruce A. CraigPublisher:W. H. Freeman