Concept explainers
a.
To calculate: The mean, median, and standard deviation for the temperatures in Los Angeles.
a.
Answer to Problem 8CFU
The mean , median , and standard deviation for the temperatures in Los Angeles are
Explanation of Solution
Given information:
The normal maximum daily temperature for Los Angeles.
| Los Angeles | Jan | Feb | March | April | May | June | July | August | Sept | Oct | Nov | Dec |
| 65.7 | 65.9 | 65.5 | 67.4 | 69.0 | 71.9 | 75.3 | 76.6 | 76.6 | 74.4 | 70.3 | 65.9 |
Formula used:
Formula of Mean
Median for even terms =
Median for odd terms =
A measure of variability associated with the arithmetic mean is the standard deviation.
Calculation:
Consider the data in ascending order ,
So,
The mean of the data is
There is even number of data.
The median of even number of data is −
The standard deviation is −
| 65.5 | 70.375 | ||
| 65.7 | 70.375 | ||
| 65.9 | 70.375 | ||
| 65.9 | 70.375 | ||
| 67.4 | 70.375 | ||
| 69.0 | 70.375 | ||
| 70.3 | 70.375 | ||
| 71.9 | 70.375 | ||
| 74.4 | 70.375 | ||
| 75.3 | 70.375 | ||
| 76.6 | 70.375 | ||
| 76.6 | 70.375 | ||
Hence, the mean , median , and standard deviation for the temperatures in Los Angeles are
b.
To calculate: The mean, median, and standard deviation for the temperatures in Las Vegas.
b.
Answer to Problem 8CFU
The mean , median , and standard deviation for the temperatures in Los Angeles are
Explanation of Solution
Given information:
The normal maximum daily temperature for Las Vegas .
| Las Vegas | Jan | Feb | March | April | May | June | July | August | Sept | Oct | Nov | Dec |
| 57.3 | 63.3 | 68.8 | 77.5 | 87.8 | 100.3 | 105.9 | 103.2 | 94.7 | 82.1 | 67.4 | 57.5 |
Formula used:
Formula of Mean
Median for even terms =
Median for odd terms =
A measure of variability associated with the arithmetic mean is the standard deviation.
Calculation:
Consider the data in ascending order,
So,
The mean of the data is
There is even number of data.
The median of even number of data is −
The standard deviation is −
| 57.3 | 80.48 | ||
| 57.5 | 80.48 | ||
| 63.3 | 80.48 | ||
| 67.4 | 80.48 | ||
| 68.8 | 80.48 | ||
| 77.5 | 80.48 | ||
| 82.1 | 80.48 | ||
| 87.8 | 80.48 | ||
| 94.7 | 80.48 | ||
| 100.3 | 80.48 | ||
| 103.2 | 80.48 | ||
| 105.9 | 80.48 | ||
Hence, the mean , median , and standard deviation for the temperatures in Los Angeles are
c.
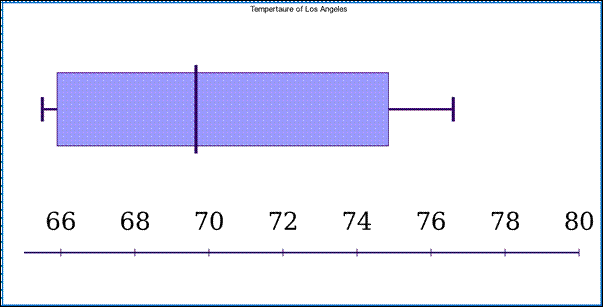
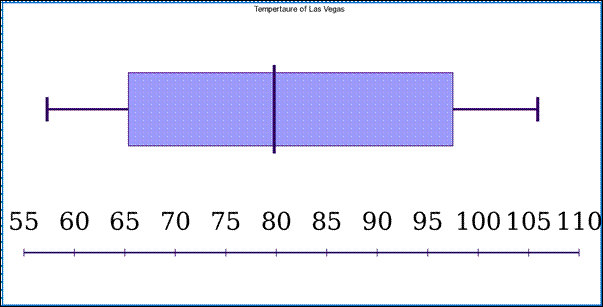
To sketch : The box-and-whisker plot for the temperatures for each city.
c.
Explanation of Solution
Given information:
The normal maximum daily temperature for Los Angeles and Las Vegas.
| Los Angeles | Jan | Feb | March | April | May | June | July | August | Sept | Oct | Nov | Dec |
| 65.7 | 65.9 | 65.5 | 67.4 | 69.0 | 71.9 | 75.3 | 76.6 | 76.6 | 74.4 | 70.3 | 65.9 | |
| Las Vegas | Jan | Feb | March | April | May | June | July | August | Sept | Oct | Nov | Dec |
| 57.3 | 63.3 | 68.8 | 77.5 | 87.8 | 100.3 | 105.9 | 103.2 | 94.7 | 82.1 | 67.4 | 57.5 |
Graph:

Figure1.

Figure2.
Interpretation:
The figure1 and figure 2 represent the temperature of the Los Angeles and Las Vegas respectively.
d.
To show: Which of the city has a smaller variability in temperature.
d.
Answer to Problem 8CFU
Las Vegas has a smaller variability in temperature.
Explanation of Solution
Given information:
The normal maximum daily temperature for Los Angeles and Las Vegas.
| Los Angeles | Jan | Feb | March | April | May | June | July | August | Sept | Oct | Nov | Dec |
| 65.7 | 65.9 | 65.5 | 67.4 | 69.0 | 71.9 | 75.3 | 76.6 | 76.6 | 74.4 | 70.3 | 65.9 | |
| Las Vegas | Jan | Feb | March | April | May | June | July | August | Sept | Oct | Nov | Dec |
| 57.3 | 63.3 | 68.8 | 77.5 | 87.8 | 100.3 | 105.9 | 103.2 | 94.7 | 82.1 | 67.4 | 57.5 |
Calculation:
Record of Los Angeles
| Terms | 12 |
| Mean | 80.48 |
| Median | 79.8 |
| Standard Deviation | 17.0551 |
Record of Las Vegas
| Terms | 12 |
| Mean | 70.375 |
| Median | 69.65 |
| Standard Deviation | 3.1352 |
Observing the record , Las Vegas has a smaller variability in temperature. As each measure of Las Vegas is lesser than the Los Angeles.
e.
To show: The cause one city might have a greater variability in temperature than another.
e.
Answer to Problem 8CFU
Pollution, temperature and many more.
Explanation of Solution
Given information:
The normal maximum daily temperature for Los Angeles and Las Vegas.
| Los Angeles | Jan | Feb | March | April | May | June | July | August | Sept | Oct | Nov | Dec |
| 65.7 | 65.9 | 65.5 | 67.4 | 69.0 | 71.9 | 75.3 | 76.6 | 76.6 | 74.4 | 70.3 | 65.9 | |
| Las Vegas | Jan | Feb | March | April | May | June | July | August | Sept | Oct | Nov | Dec |
| 57.3 | 63.3 | 68.8 | 77.5 | 87.8 | 100.3 | 105.9 | 103.2 | 94.7 | 82.1 | 67.4 | 57.5 |
Calculation:
Record of Los Angeles
| Terms | 12 |
| Mean | 80.48 |
| Median | 79.8 |
| Standard Deviation | 17.0551 |
Record of Las Vegas
| Terms | 12 |
| Mean | 70.375 |
| Median | 69.65 |
| Standard Deviation | 3.1352 |
The reason might the pollution, humidity, environment and could affect the temperature of the cities in large variation.
Chapter 14 Solutions
Advanced Mathematical Concepts: Precalculus with Applications, Student Edition
Additional Math Textbook Solutions
Single Variable Calculus: Early Transcendentals (2nd Edition) - Standalone book
Precalculus
Thomas' Calculus: Early Transcendentals (14th Edition)
Calculus and Its Applications (11th Edition)
Precalculus
Calculus: Early Transcendentals (2nd Edition)
 Calculus: Early TranscendentalsCalculusISBN:9781285741550Author:James StewartPublisher:Cengage Learning
 Thomas' Calculus (14th Edition)CalculusISBN:9780134438986Author:Joel R. Hass, Christopher E. Heil, Maurice D. WeirPublisher:PEARSON
 Calculus: Early Transcendentals (3rd Edition)CalculusISBN:9780134763644Author:William L. Briggs, Lyle Cochran, Bernard Gillett, Eric SchulzPublisher:PEARSON
 Calculus: Early TranscendentalsCalculusISBN:9781319050740Author:Jon Rogawski, Colin Adams, Robert FranzosaPublisher:W. H. Freeman
 Calculus: Early Transcendental FunctionsCalculusISBN:9781337552516Author:Ron Larson, Bruce H. EdwardsPublisher:Cengage Learning


