
Concept explainers
Videos
(a)
To construct: an appropriate
(a)
Answer to Problem 49E
Positive curve strong
Explanation of Solution
Given:
| Mammal | Length of Cavity of left ventricle (cm) | Heart weight |
| Mouse | 0.55 | 0.13 |
| Rat | 1 | 0.64 |
| Rabbit | 2.2 | 5.8 |
| Dog | 4 | 102 |
| Sheep | 6.5 | 210 |
| Ox | 12 | 2030 |
| Horse | 16 | 3900 |
Graph:
Scatter plot
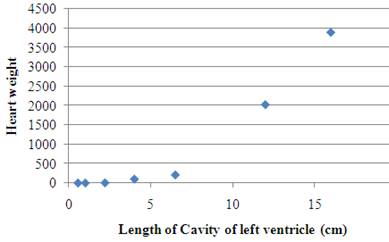
Form: curve, the reason is that the points are not lying on the straight line
Direction: Positive, the reason is that the scatter plot slope is going to upwards.
Strength: strong, the reason is that all points lie very near together in the same pattern.
(b)
To Explain: that this relationship follows an exponential model or a power model.
(b)
Answer to Problem 49E
Power Model
Explanation of Solution
Given:
| Mammal | Length of Cavity of left ventricle (cm) | Heart weight |
| Mouse | 0.55 | 0.13 |
| Rat | 1 | 0.64 |
| Rabbit | 2.2 | 5.8 |
| Dog | 4 | 102 |
| Sheep | 6.5 | 210 |
| Ox | 12 | 2030 |
| Horse | 16 | 3900 |
Graph:
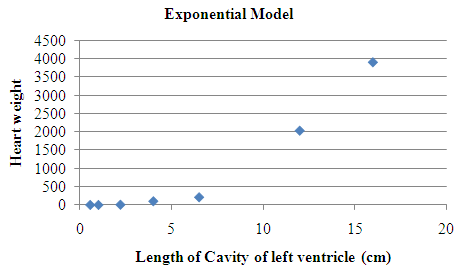
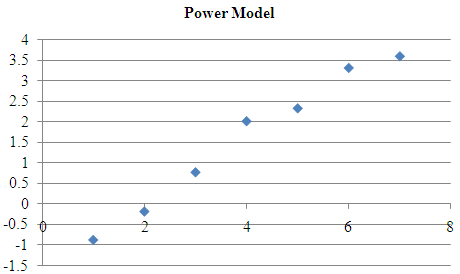
The model for the relation between the variables is the model with the most linear pattern in the associate scatter plot” Power Model
(c)
To Explain: the equation of the regression line.
(c)
Answer to Problem 49E
Explanation of Solution
Given:
| Mammal | Length of Cavity of left ventricle (cm) | Heart weight |
| Mouse | 0.55 | 0.13 |
| Rat | 1 | 0.64 |
| Rabbit | 2.2 | 5.8 |
| Dog | 4 | 102 |
| Sheep | 6.5 | 210 |
| Ox | 12 | 2030 |
| Horse | 16 | 3900 |
Formula used:
Calculation:
X is the logarithm of length and Y is the logarithm of heart weight
| Length of Cavity of left ventricle X | Heart weight Y | XY | |
| -0.597837001 | -2.040220829 | 1.219719501 | 0.357409 |
| 0 | -0.446287103 | 0 | 0 |
| 0.78845736 | 1.757857918 | 1.385996014 | 0.621665 |
| 1.386294361 | 4.624972813 | 6.411573731 | 1.921812 |
| 1.871802177 | 5.347107531 | 10.00872752 | 3.503643 |
| 2.48490665 | 7.615791072 | 18.92452988 | 6.174761 |
| 2.772588722 | 8.268731832 | 22.92579262 | 7.687248 |
Using from the table find the value of a and b
Substituting the value of a and b in the regression equation formula
The least squares regression equation
Where x is the length and y the heart weight
(d)
To Explain: the prediction from the part (c) of heart weight of a human who has a left ventricle 6.8 cm long.
(d)
Answer to Problem 49E
299.825 grams
Explanation of Solution
Given:
| Mammal | Length of Cavity of left ventricle (cm) | Heart weight |
| Mouse | 0.55 | 0.13 |
| Rat | 1 | 0.64 |
| Rabbit | 2.2 | 5.8 |
| Dog | 4 | 102 |
| Sheep | 6.5 | 210 |
| Ox | 12 | 2030 |
| Horse | 16 | 3900 |
Calculation:
Using the part (c)
Putting the value of x
Taking the exponential
Therefore the expected heart weight is 299.825 grams.
Chapter 12 Solutions
PRACTICE OF STATISTICS F/AP EXAM
Additional Math Textbook Solutions
Basic Business Statistics, Student Value Edition
Elementary Statistics (13th Edition)
Elementary Statistics
Algebra and Trigonometry (6th Edition)


 MATLAB: An Introduction with ApplicationsStatisticsISBN:9781119256830Author:Amos GilatPublisher:John Wiley & Sons Inc
 Probability and Statistics for Engineering and th...StatisticsISBN:9781305251809Author:Jay L. DevorePublisher:Cengage Learning
 Statistics for The Behavioral Sciences (MindTap C...StatisticsISBN:9781305504912Author:Frederick J Gravetter, Larry B. WallnauPublisher:Cengage Learning
 Elementary Statistics: Picturing the World (7th E...StatisticsISBN:9780134683416Author:Ron Larson, Betsy FarberPublisher:PEARSON
 The Basic Practice of StatisticsStatisticsISBN:9781319042578Author:David S. Moore, William I. Notz, Michael A. FlignerPublisher:W. H. Freeman
 Introduction to the Practice of StatisticsStatisticsISBN:9781319013387Author:David S. Moore, George P. McCabe, Bruce A. CraigPublisher:W. H. Freeman