
Concept explainers
Videos
(a)
To find: the estimate for
(a)
Answer to Problem 8E
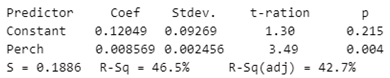
The proportion of perch killed is on average 0.12049, when the number of perch in the pen is zero.
Explanation of Solution
Given:

The y-intercept shows the average value of y when x=0
The proportion of perch killed is on average 0.12049, when the number of perch in the pen is zero.
(b)
To find: the estimate for
(b)
Answer to Problem 8E
The proportion of perch killed increases by 0.008569 per beer on average.
Explanation of Solution
Given:
Slope is representing the average increase of y per unit of x.
The proportion of perch killed increases by 0.008569 per beer on average.
(c)
To find: the estimate for
(c)
Answer to Problem 8E
The expected proportion of perch killed deviates on average by 0.1886 from the actual proportion of perch killed.
Explanation of Solution
Given:

s=0.1886
Standard error of the estimate s shows the average error of prediction, therefore the average deviation between actual values of y and the predicted y values.
The expected proportion of perch killed deviates on average by 0.1886 from the actual proportion of perch killed.
(d)
To find: the standard error of the slope
(d)
Answer to Problem 8E
Slope of regression line vary on average about 0.002456 from the slope of the population regression line.
Explanation of Solution
Given:

Standard error of the slope
Standard error of the slope shows the average deviation of the slope of regression line of the sample from the population regression line of the slope.
Slope of regression line vary on average about 0.002456 from the slope of the population regression line.
Chapter 12 Solutions
PRACTICE OF STATISTICS F/AP EXAM
Additional Math Textbook Solutions
Statistics for Business and Economics (13th Edition)
Introductory Statistics (2nd Edition)
Introductory Statistics
Basic Business Statistics, Student Value Edition (13th Edition)
Intro Stats, Books a la Carte Edition (5th Edition)
Introductory Statistics (10th Edition)


 MATLAB: An Introduction with ApplicationsStatisticsISBN:9781119256830Author:Amos GilatPublisher:John Wiley & Sons Inc
 Probability and Statistics for Engineering and th...StatisticsISBN:9781305251809Author:Jay L. DevorePublisher:Cengage Learning
 Statistics for The Behavioral Sciences (MindTap C...StatisticsISBN:9781305504912Author:Frederick J Gravetter, Larry B. WallnauPublisher:Cengage Learning
 Elementary Statistics: Picturing the World (7th E...StatisticsISBN:9780134683416Author:Ron Larson, Betsy FarberPublisher:PEARSON
 The Basic Practice of StatisticsStatisticsISBN:9781319042578Author:David S. Moore, William I. Notz, Michael A. FlignerPublisher:W. H. Freeman
 Introduction to the Practice of StatisticsStatisticsISBN:9781319013387Author:David S. Moore, George P. McCabe, Bruce A. CraigPublisher:W. H. Freeman