PRACTICE OF STATISTICS F/AP EXAM
6th Edition
ISBN: 9781319113339
Author: Starnes
Publisher: MAC HIGHER
bartleby

Concept explainers

bartleby

Videos

Question
Book Icon
Chapter 12.1, Problem 9E

(a)

To determine

To find: the critical value and confidence interval for a 99% confidence interval.

(a)

Expert Solution
Check Mark

Answer to Problem 9E

Critical value: 2.977

Confidence interval: (0.0108192, 0.0251088)

Explanation of Solution

Given:

  PRACTICE OF STATISTICS F/AP EXAM, Chapter 12.1, Problem 9E , additional homework tip  1

Formula used:

The boundaries of the confidence interval

  bt*×SEb1b+t*×SEb1

Calculation:

Slope b1 is mention in the row “Beers” and in the column “Coefficient” of the mention output from computer

  b1 =0.017964

The calculated standard deviation of the slope SEb1 is mention in the row “Beers” and in the column “s. E. Of coeff” of the mention output from the computer

  SEb1 =0.0024

Degree of freedom = 16-2=14

The t-value can be determine in the student’s T distribution table df=14 and column of c= 99%

  t*=2.977

The boundaries of the confidence interval

  bt*×SEb1=0.0179642.977×0.0024=0.0108192b+t*×SEb1=0.017964+2.977×0.0024=0.0251088

(b)

To determine

To Explain: the interval from part (a).

(b)

Expert Solution
Check Mark

Explanation of Solution

Given:

  PRACTICE OF STATISTICS F/AP EXAM, Chapter 12.1, Problem 9E , additional homework tip  2

Calculation:

From part (a)

  bt*×SEb1=0.0179642.977×0.0024=0.0108192b+t*×SEb1=0.017964+2.977×0.0024=0.0251088

There are 99 percent confident that the true slope of the regression line of the population is between 0.0108192 and 0.0251088.

(c)

To determine

To Explain: the meaning of 99% confident.

(c)

Expert Solution
Check Mark

Explanation of Solution

Given:

  PRACTICE OF STATISTICS F/AP EXAM, Chapter 12.1, Problem 9E , additional homework tip  3

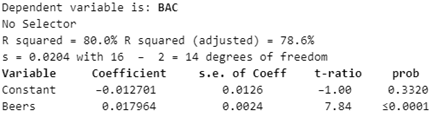
The 99 percent confidence interval shows the slope of the true regression line. It is also say that 99 percent confidence means that it is predicted about 99 percent of all samples to have a 99 percent confidence interval that is having the true population parameter.

Chapter 12 Solutions

PRACTICE OF STATISTICS F/AP EXAM

Ch. 12.1 - Prob. 11ECh. 12.1 - Prob. 12ECh. 12.1 - Prob. 13ECh. 12.1 - Prob. 14ECh. 12.1 - Prob. 15ECh. 12.1 - Prob. 16ECh. 12.1 - Prob. 17ECh. 12.1 - Prob. 18ECh. 12.1 - Prob. 19ECh. 12.1 - Prob. 20ECh. 12.1 - Prob. 21ECh. 12.1 - Prob. 22ECh. 12.1 - Prob. 23ECh. 12.1 - Prob. 24ECh. 12.1 - Prob. 25ECh. 12.1 - Prob. 26ECh. 12.1 - Prob. 27ECh. 12.1 - Prob. 28ECh. 12.1 - Prob. 29ECh. 12.1 - Prob. 30ECh. 12.1 - Prob. 31ECh. 12.1 - Prob. 32ECh. 12.2 - Prob. 33ECh. 12.2 - Prob. 34ECh. 12.2 - Prob. 35ECh. 12.2 - Prob. 36ECh. 12.2 - Prob. 37ECh. 12.2 - Prob. 38ECh. 12.2 - Prob. 39ECh. 12.2 - Prob. 40ECh. 12.2 - Prob. 41ECh. 12.2 - Prob. 42ECh. 12.2 - Prob. 43ECh. 12.2 - Prob. 44ECh. 12.2 - Prob. 45ECh. 12.2 - Prob. 46ECh. 12.2 - Prob. 47ECh. 12.2 - Prob. 48ECh. 12.2 - Prob. 49ECh. 12.2 - Prob. 50ECh. 12.2 - Prob. 51ECh. 12.2 - Prob. 52ECh. 12.2 - Prob. 53ECh. 12.2 - Prob. 54ECh. 12.2 - Prob. 55ECh. 12.2 - Prob. 56ECh. 12.2 - Prob. 57ECh. 12.2 - Prob. 58ECh. 12 - Prob. R12.1RECh. 12 - Prob. R12.2RECh. 12 - Prob. R12.3RECh. 12 - Prob. R12.4RECh. 12 - Prob. R12.5RECh. 12 - Prob. R12.6RECh. 12 - Prob. T12.1SPTCh. 12 - Prob. T12.2SPTCh. 12 - Prob. T12.3SPTCh. 12 - Prob. T12.4SPTCh. 12 - Prob. T12.5SPTCh. 12 - Prob. T12.6SPTCh. 12 - Prob. T12.7SPTCh. 12 - Prob. T12.8SPTCh. 12 - Prob. T12.9SPTCh. 12 - Prob. T12.10SPTCh. 12 - Prob. T12.11SPTCh. 12 - Prob. T12.12SPTCh. 12 - Prob. AP4.1CPTCh. 12 - Prob. AP4.2CPTCh. 12 - Prob. AP4.3CPTCh. 12 - Prob. AP4.4CPTCh. 12 - Prob. AP4.5CPTCh. 12 - Prob. AP4.6CPTCh. 12 - Prob. AP4.7CPTCh. 12 - Prob. AP4.8CPTCh. 12 - Prob. AP4.9CPTCh. 12 - Prob. AP4.10CPTCh. 12 - Prob. AP4.11CPTCh. 12 - Prob. AP4.12CPTCh. 12 - Prob. AP4.13CPTCh. 12 - Prob. AP4.14CPTCh. 12 - Prob. AP4.15CPTCh. 12 - Prob. AP4.16CPTCh. 12 - Prob. AP4.17CPTCh. 12 - Prob. AP4.18CPTCh. 12 - Prob. AP4.19CPTCh. 12 - Prob. AP4.20CPTCh. 12 - Prob. AP4.21CPTCh. 12 - Prob. AP4.22CPTCh. 12 - Prob. AP4.23CPTCh. 12 - Prob. AP4.24CPTCh. 12 - Prob. AP4.25CPTCh. 12 - Prob. AP4.26CPTCh. 12 - Prob. AP4.27CPTCh. 12 - Prob. AP4.28CPTCh. 12 - Prob. AP4.29CPTCh. 12 - Prob. AP4.30CPTCh. 12 - Prob. AP4.31CPTCh. 12 - Prob. AP4.32CPTCh. 12 - Prob. AP4.33CPTCh. 12 - Prob. AP4.34CPTCh. 12 - Prob. AP4.35CPTCh. 12 - Prob. AP4.36CPTCh. 12 - Prob. AP4.37CPTCh. 12 - Prob. AP4.38CPTCh. 12 - Prob. AP4.39CPTCh. 12 - Prob. AP4.40CPTCh. 12 - Prob. AP4.41CPTCh. 12 - Prob. AP4.42CPTCh. 12 - Prob. AP4.43CPTCh. 12 - Prob. AP4.44CPTCh. 12 - Prob. AP4.45CPTCh. 12 - Prob. AP4.46CPT
Knowledge Booster
Background pattern image
Statistics
Learn more about
Need a deep-dive on the concept behind this application? Look no further. Learn more about this topic, statistics and related others by exploring similar questions and additional content below.
Recommended textbooks for you
Text book image
MATLAB: An Introduction with Applications
Statistics
ISBN:9781119256830
Author:Amos Gilat
Publisher:John Wiley & Sons Inc
Text book image
Probability and Statistics for Engineering and th...
Statistics
ISBN:9781305251809
Author:Jay L. Devore
Publisher:Cengage Learning
Text book image
Statistics for The Behavioral Sciences (MindTap C...
Statistics
ISBN:9781305504912
Author:Frederick J Gravetter, Larry B. Wallnau
Publisher:Cengage Learning
Text book image
Elementary Statistics: Picturing the World (7th E...
Statistics
ISBN:9780134683416
Author:Ron Larson, Betsy Farber
Publisher:PEARSON
Text book image
The Basic Practice of Statistics
Statistics
ISBN:9781319042578
Author:David S. Moore, William I. Notz, Michael A. Fligner
Publisher:W. H. Freeman
Text book image
Introduction to the Practice of Statistics
Statistics
ISBN:9781319013387
Author:David S. Moore, George P. McCabe, Bruce A. Craig
Publisher:W. H. Freeman
Statistics 4.1 Point Estimators; Author: Dr. Jack L. Jackson II;https://www.youtube.com/watch?v=2MrI0J8XCEE;License: Standard YouTube License, CC-BY
Statistics 101: Point Estimators; Author: Brandon Foltz;https://www.youtube.com/watch?v=4v41z3HwLaM;License: Standard YouTube License, CC-BY
Central limit theorem; Author: 365 Data Science;https://www.youtube.com/watch?v=b5xQmk9veZ4;License: Standard YouTube License, CC-BY
Point Estimate Definition & Example; Author: Prof. Essa;https://www.youtube.com/watch?v=OTVwtvQmSn0;License: Standard Youtube License
Point Estimation; Author: Vamsidhar Ambatipudi;https://www.youtube.com/watch?v=flqhlM2bZWc;License: Standard Youtube License