
Concept explainers
Videos
To find: that these data is providing convincing evidence at the
Answer to Problem 16E
There is enough convincing proof that there is a linear relationship between time at the table and calories consumed in the population of toddlers.
Explanation of Solution
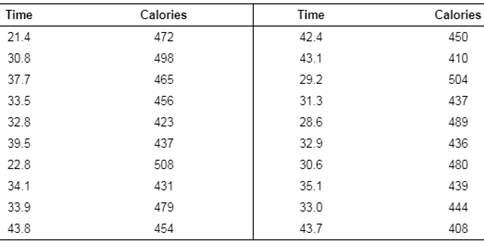
Given:
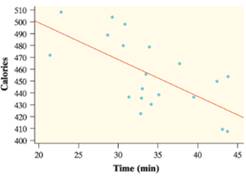
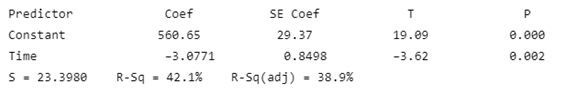
Output of the computer from a least squares
Claim: Slope is negative (reduction)
Formula used:
Test statistics
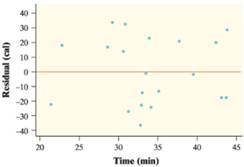
Calculation:
The calculation of the slope
The calculated standard deviation of the slope
The null hypothesis or the alternative hypothesis is the statement the given claim. The null hypothesis is the statements that slope is zero. If the mention claim is the null hypothesis, then the alternative hypothesis statement is the opposite of the null hypothesis.
Test statistic:
The P-value is the probability of getting the value of the test statistic.
If the P-value is equal or lesser than to the significance level, then the null hypothesis should be rejected:
There is enough convincing proof that there is a linear relationship between time at the table and calories consumed in the population of toddlers.
Chapter 12 Solutions
PRACTICE OF STATISTICS F/AP EXAM
Additional Math Textbook Solutions
Basic Business Statistics, Student Value Edition
Elementary Statistics
Statistics: The Art and Science of Learning from Data (4th Edition)
Intro Stats, Books a la Carte Edition (5th Edition)


 MATLAB: An Introduction with ApplicationsStatisticsISBN:9781119256830Author:Amos GilatPublisher:John Wiley & Sons Inc
 Probability and Statistics for Engineering and th...StatisticsISBN:9781305251809Author:Jay L. DevorePublisher:Cengage Learning
 Statistics for The Behavioral Sciences (MindTap C...StatisticsISBN:9781305504912Author:Frederick J Gravetter, Larry B. WallnauPublisher:Cengage Learning
 Elementary Statistics: Picturing the World (7th E...StatisticsISBN:9780134683416Author:Ron Larson, Betsy FarberPublisher:PEARSON
 The Basic Practice of StatisticsStatisticsISBN:9781319042578Author:David S. Moore, William I. Notz, Michael A. FlignerPublisher:W. H. Freeman
 Introduction to the Practice of StatisticsStatisticsISBN:9781319013387Author:David S. Moore, George P. McCabe, Bruce A. CraigPublisher:W. H. Freeman