
Concept explainers
Videos
(a)
To find: that is it reasonable to use a power model to explain the relation between the period of pendulum and the length.
(a)
Answer to Problem 38E
From the equation, it is noticed that the
Explanation of Solution
Given:


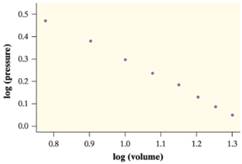
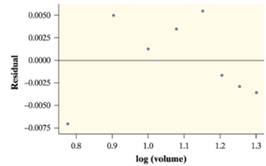
From the equation, it is noticed that the scatter plot of log (volume) and log (pressure) is linear and the residual figure represents no obvious leftover patterns.
(b)
To find: the equation of the least squares of regression line.
(b)
Answer to Problem 38E
Explanation of Solution
Given:

Calculation:
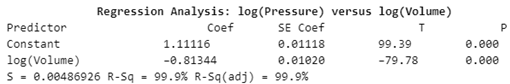
On the basis of given information the general regression equation is
Calculate the
Calculate the
Putting the value of
(c)
To Explain: the prediction of the pressure in the syringe if the volume is 17 cubic cm with using the part (a)
(c)
Answer to Problem 38E
1.28914 atm
Explanation of Solution
Given:


Calculation:
From the part (b)
Putting the value of volume by 17 and calculate
Taking the exponential with 10
Therefore the expected pressure is 1.28914 atm.
Chapter 12 Solutions
PRACTICE OF STATISTICS F/AP EXAM
Additional Math Textbook Solutions
Calculus: Early Transcendentals (2nd Edition)
Elementary Statistics: Picturing the World (7th Edition)
University Calculus: Early Transcendentals (4th Edition)
A Problem Solving Approach To Mathematics For Elementary School Teachers (13th Edition)
Basic Business Statistics, Student Value Edition


 MATLAB: An Introduction with ApplicationsStatisticsISBN:9781119256830Author:Amos GilatPublisher:John Wiley & Sons Inc
 Probability and Statistics for Engineering and th...StatisticsISBN:9781305251809Author:Jay L. DevorePublisher:Cengage Learning
 Statistics for The Behavioral Sciences (MindTap C...StatisticsISBN:9781305504912Author:Frederick J Gravetter, Larry B. WallnauPublisher:Cengage Learning
 Elementary Statistics: Picturing the World (7th E...StatisticsISBN:9780134683416Author:Ron Larson, Betsy FarberPublisher:PEARSON
 The Basic Practice of StatisticsStatisticsISBN:9781319042578Author:David S. Moore, William I. Notz, Michael A. FlignerPublisher:W. H. Freeman
 Introduction to the Practice of StatisticsStatisticsISBN:9781319013387Author:David S. Moore, George P. McCabe, Bruce A. CraigPublisher:W. H. Freeman