
Concept explainers
Videos
To Explain: that there is convincing evidence of a negative linear relationship between researcher’ swim time and his pulse rate, yes or not.
Answer to Problem 18E
There is convincing proof that there is a negative linear relationship between researcher’s swim time and his pulse rate in the population of days on which he swims 2000 yards.
Explanation of Solution
Given:
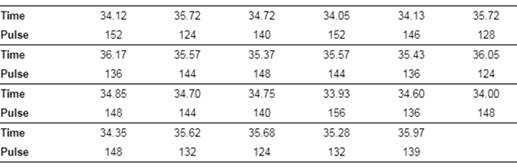
Given claim: Slope is negative
Formula used:
The test statistics
Calculation:
Typing the Time data values in the first column of the spreadsheet of Minitab and type the Pulse data values in the second column.
Click on Start >Regression > Regression > Fit Regression model
Type the Pulse under Responses and type Time under Continuous predictors.
The resulting output is
The calculation of the slope
The calculated standard deviation of the slope
The calculated standard deviation of the slope
The null hypothesis or the alternative hypothesis is the statement the mention claim. The null hypothesis is the statement that the slope is zero. If the mention claim is the null hypothesis, then the alternative hypothesis statement is the opposite of the null hypothesis.
The test statistic:
The P-value is the probability of getting the value of the test statistic.
If the P-value is equal or lesser than to the significance level, then the null hypothesis is rejected:
There is convincing proof that there is a negative linear relationship between researcher’s swim time and his pulse rate in the population of days on which he swims 2000 yards.
Chapter 12 Solutions
PRACTICE OF STATISTICS F/AP EXAM
Additional Math Textbook Solutions
Statistics for Business and Economics (13th Edition)
Elementary Statistics Using Excel (6th Edition)
Introductory Statistics
Basic Business Statistics, Student Value Edition
Basic Business Statistics, Student Value Edition (13th Edition)
Statistics: The Art and Science of Learning from Data (4th Edition)


 MATLAB: An Introduction with ApplicationsStatisticsISBN:9781119256830Author:Amos GilatPublisher:John Wiley & Sons Inc
 Probability and Statistics for Engineering and th...StatisticsISBN:9781305251809Author:Jay L. DevorePublisher:Cengage Learning
 Statistics for The Behavioral Sciences (MindTap C...StatisticsISBN:9781305504912Author:Frederick J Gravetter, Larry B. WallnauPublisher:Cengage Learning
 Elementary Statistics: Picturing the World (7th E...StatisticsISBN:9780134683416Author:Ron Larson, Betsy FarberPublisher:PEARSON
 The Basic Practice of StatisticsStatisticsISBN:9781319042578Author:David S. Moore, William I. Notz, Michael A. FlignerPublisher:W. H. Freeman
 Introduction to the Practice of StatisticsStatisticsISBN:9781319013387Author:David S. Moore, George P. McCabe, Bruce A. CraigPublisher:W. H. Freeman