
Concept explainers
Videos
(a)
To calculate the conditional distribution of reported sports goals for each gender.
(a)
Explanation of Solution
Given:
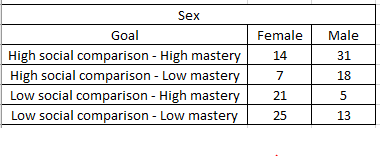
The data students classified into four categories based on their responses of 67 males and 67 females are shown below
Calculation:
The conditional distribution of reported goals for each gender are shown below
The proportions are calculated for each gender
For females proportions are calculated by dividing females with HSC-HM, HSC-LM, LSC-HM, LSC-LM by total females.
For males proportions are calculated by dividing males with HSC-HM, HSC-LM, LSC-HM, LSC-LM by total males.
(b)
To plot an appropriate graph to compare the conditional distribution.
(b)
Explanation of Solution
Given:
The data students classified into four categories based on their responses of 67 males and 67 females and its conditional distribution is shown below
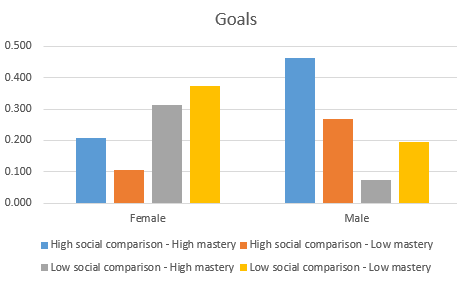
The comparison of goals for each gender in each category is done in multiple bar graph. Each category is along the horizontal axis and proportion along the vertical axis.
Graph:

(c)
To compare the distributions of sports goals for male and female undergraduates with reference to a multiple bar graph.
(c)
Explanation of Solution
Given:
The data students classified into four categories based on their responses of 67 males and 67 females and its conditional distribution is plotted as shown below
Interpretation:
From the bar graph we can conclude that females have goals with low social comparison and low mastery while male have goals with high social comparison and high mastery.
Chapter 11 Solutions
The Practice of Statistics for AP - 4th Edition
Additional Math Textbook Solutions
Basic Business Statistics, Student Value Edition
Statistics: The Art and Science of Learning from Data (4th Edition)
Elementary Statistics: Picturing the World (6th Edition)


 MATLAB: An Introduction with ApplicationsStatisticsISBN:9781119256830Author:Amos GilatPublisher:John Wiley & Sons Inc
 Probability and Statistics for Engineering and th...StatisticsISBN:9781305251809Author:Jay L. DevorePublisher:Cengage Learning
 Statistics for The Behavioral Sciences (MindTap C...StatisticsISBN:9781305504912Author:Frederick J Gravetter, Larry B. WallnauPublisher:Cengage Learning
 Elementary Statistics: Picturing the World (7th E...StatisticsISBN:9780134683416Author:Ron Larson, Betsy FarberPublisher:PEARSON
 The Basic Practice of StatisticsStatisticsISBN:9781319042578Author:David S. Moore, William I. Notz, Michael A. FlignerPublisher:W. H. Freeman
 Introduction to the Practice of StatisticsStatisticsISBN:9781319013387Author:David S. Moore, George P. McCabe, Bruce A. CraigPublisher:W. H. Freeman