
Videos
a.
To construct: The appropriate graph that shows the relationship between two variables and interpret it. Also, explain the relationship between laundry practices and the choice of detergent
a.
Explanation of Solution
Given:
The table is:
| Soft, warm | Soft, hot | Hard, warm | Hard, hot | |
| Standard | 0.4569 | 0.4821 | 0.3818 | 0.4167 |
| New | 0.5431 | 0.5179 | 0.6182 | 0.5833 |
Graph:
The figure could be constructed as:
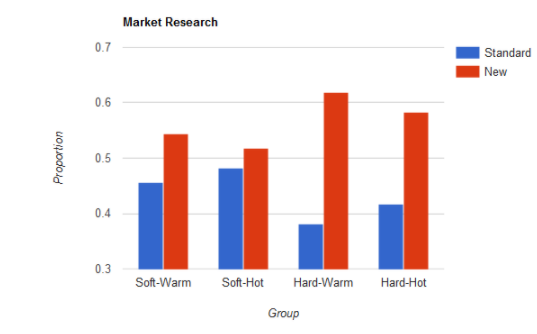
Interpretation:
From the above figure, it is clear that most of the people in each category are preferring the new product and it is the highest in the “Hard-Warm” group and the lowest in the “Soft-Hot: group.
b.
To check: If the sample is providing sufficient evidence to conclude that the practices of laundry and preferences of product are independent or not.
b.
Explanation of Solution
Calculation:
The appropriate null and alternative hypotheses for the provided test could be written as:
The expected count is computed as:
| Soft, warm | Soft, hot | Hard, warm | Hard, hot | |
| Standard | 49.8079 | 24.0452 | 47.2316 | 30.9153 |
| New | 66.1921 | 31.9548 | 62.7684 | 41.0847 |
The test statistic is:
The degree of freedom is calculated as:
The p-value using chi-square table at 3 degree of freedom is 0.560
The p -value is above significance level. The null hypothesis does not get rejected. Thus, there is insufficient evidence to conclude that there is an association between two variables.
Chapter 11 Solutions
The Practice of Statistics for AP - 4th Edition
Additional Math Textbook Solutions
Statistics for Business and Economics (13th Edition)
Introductory Statistics
Intro Stats, Books a la Carte Edition (5th Edition)
Statistical Reasoning for Everyday Life (5th Edition)


 MATLAB: An Introduction with ApplicationsStatisticsISBN:9781119256830Author:Amos GilatPublisher:John Wiley & Sons Inc
 Probability and Statistics for Engineering and th...StatisticsISBN:9781305251809Author:Jay L. DevorePublisher:Cengage Learning
 Statistics for The Behavioral Sciences (MindTap C...StatisticsISBN:9781305504912Author:Frederick J Gravetter, Larry B. WallnauPublisher:Cengage Learning
 Elementary Statistics: Picturing the World (7th E...StatisticsISBN:9780134683416Author:Ron Larson, Betsy FarberPublisher:PEARSON
 The Basic Practice of StatisticsStatisticsISBN:9781319042578Author:David S. Moore, William I. Notz, Michael A. FlignerPublisher:W. H. Freeman
 Introduction to the Practice of StatisticsStatisticsISBN:9781319013387Author:David S. Moore, George P. McCabe, Bruce A. CraigPublisher:W. H. Freeman