
Concept explainers
Videos
a.
To explain: The conditions for performing the chi-square test are met.
a.
Explanation of Solution
Given:
The given observe table for both questions,
| Black Parents ( B ) | Hispanic Parents ( H ) | White Parents ( W ) | |
| Excellent | 12 | 34 | 22 |
| Good | 69 | 55 | 81 |
| Fair | 75 | 61 | 60 |
| Poor | 24 | 24 | 24 |
| Don’t know | 22 | 28 | 14 |
| Total | 202 | 202 | 201 |
The expected table is,
| Black Parents ( B ) | Hispanic Parents ( H ) | White Parents ( W ) | |
| Excellent | 22.7041 | 22.7041 | 22.5917 |
| Good | 68.4463 | 68.4463 | 68.1074 |
| Fair | 65.4413 | 65.4413 | 65.1174 |
| Poor | 24.0397 | 24.0397 | 23.9207 |
| Don’t know | 21.3686 | 21.3686 | 21.2628 |
The requirments to use chi-suare test is,
- Two categorical variables.
- Two or more categories for each variable
- Independence of observations
- Expected frequency for each cell are at least 1 or it should be at least 5 for the majority (80%) of the cells.
Since, each condition is satisfied by the given information. Therefore, chi-square test it can be used for the give dataset.
b.
To compute: The p-value of chi-square test.
b.
Answer to Problem 32E
The p-values is 0.0042.
Explanation of Solution
Given:
From exercise 30, the test statistics is 22.4260, respectively.
Formula used:
Calculation:
The degree of freedom for both test values, it can be calculated as
For 27 exercise,
There is the following commend to find p-value on TI83,
“
The output is,
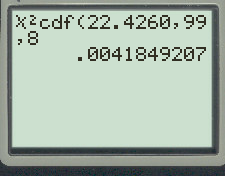
Thus, the p-value is 0.0042.
c.
To explain: Give an interpretation for the p-value.
c.
Explanation of Solution
From 30, the null and alternative hypothesis,
If the null hypothesis is true, then p-value is probability of obtaining results as extreme for test statistic value.
If there is no relation between black, Hispanic, and white parents, then the probability of getting a sample as extreme or more extreme as the given sample is 0.0042.
d.
To conclude: find the conclusion.
d.
Explanation of Solution
The null hypothesis is rejected when the p-value is less than level of significance.
Here, the p-value is less than level of significance. Thus, the null hypothesis is rejected.
Therefore, there is a sufficient evidence to conclude that there is a difference between black, Hispanic, and white parents.
Chapter 11 Solutions
The Practice of Statistics for AP - 4th Edition
Additional Math Textbook Solutions
Introductory Statistics (10th Edition)
Essentials of Statistics (6th Edition)
Intro Stats
An Introduction to Mathematical Statistics and Its Applications (6th Edition)


 MATLAB: An Introduction with ApplicationsStatisticsISBN:9781119256830Author:Amos GilatPublisher:John Wiley & Sons Inc
 Probability and Statistics for Engineering and th...StatisticsISBN:9781305251809Author:Jay L. DevorePublisher:Cengage Learning
 Statistics for The Behavioral Sciences (MindTap C...StatisticsISBN:9781305504912Author:Frederick J Gravetter, Larry B. WallnauPublisher:Cengage Learning
 Elementary Statistics: Picturing the World (7th E...StatisticsISBN:9780134683416Author:Ron Larson, Betsy FarberPublisher:PEARSON
 The Basic Practice of StatisticsStatisticsISBN:9781319042578Author:David S. Moore, William I. Notz, Michael A. FlignerPublisher:W. H. Freeman
 Introduction to the Practice of StatisticsStatisticsISBN:9781319013387Author:David S. Moore, George P. McCabe, Bruce A. CraigPublisher:W. H. Freeman