Engineering Electromagnetics
9th Edition
ISBN: 9780078028151
Author: Hayt, William H. (william Hart), Jr, BUCK, John A.
Publisher: Mcgraw-hill Education,
expand_more
expand_more
format_list_bulleted
Videos
Textbook Question
Chapter 10, Problem 10.17P
Determine the average power absorbed by each resistor in Figure 10.30.
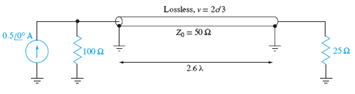
Figure 10.30 See Problem 10.17.
Expert Solution & Answer
Want to see the full answer?
Check out a sample textbook solution
Students have asked these similar questions
Calculate the power dissipated by the voltmeter and by resistor R in Figure 10.9 when (a) R=250 ohm (b) R=2Mohm. Assume that the voltmeter sensitivity (sometimes called figure of merit) is 10 kohm/V.
In the circuit shown in Figure 10.14, use nodal analysis to find V₁.
R₁
V₁
652
52 20° V
Figure 10.14
O a. V₁ = 24.07-j9.72 V
O b. V₁ = 20.07 -j9.72 V
O c. V₁ = 12.07 -j9.72 V
O d. V1 = 16.07 -j9.72 V
R₂
792
Zc
-18 2
Can I have help with problem 11.26?
Chapter 10 Solutions
Engineering Electromagnetics
Ch. 10 - The parameters of a certain transmission line...Ch. 10 - A sinusoidal wave on a transmission line is...Ch. 10 - Prob. 10.3PCh. 10 - A sinusoidal voltage V0, frequency , and phase...Ch. 10 - Two voltage waves of equal amplitude V0 and radian...Ch. 10 - A 50 load is attached to a 50-m section of the...Ch. 10 - Prob. 10.7PCh. 10 - An absolute measure of power is the dBm scale, in...Ch. 10 - A 100-m transmission line is used to propagate a...Ch. 10 - Two lossless transmission lines having different...
Ch. 10 - Two voltage waves of equal amplitude V0, which...Ch. 10 - In a circuit in which a sinusoidal voltage source...Ch. 10 - The skin effect mechanism in transmission lines is...Ch. 10 - A lossless transmission line having characteristic...Ch. 10 - Figure 10.29 See Problem 10.15. For the...Ch. 10 - A 100 lossless transmission line is connected to a...Ch. 10 - Determine the average power absorbed by each...Ch. 10 - The line shown in Figure 10.31 is lossless. Find s...Ch. 10 - A lossless transmission line is 50 cm in length...Ch. 10 - (a) Determine s on the transmission line of Figure...Ch. 10 - Prob. 10.21PCh. 10 - Prob. 10.22PCh. 10 - The normalized load on a lossless transmission...Ch. 10 - Prob. 10.24PCh. 10 - Prob. 10.25PCh. 10 - A 75 lossless line is of length 1.2 . It is...Ch. 10 - Prob. 10.27PCh. 10 - The wavelength on a certain lossless line is 10...Ch. 10 - Prob. 10.29PCh. 10 - A two-wire line constructed of lossless wire of...Ch. 10 - In order to compare the relative sharpness of the...Ch. 10 - In Figure 10.17, let ZL=250 and Z0=50. Find the...Ch. 10 - In Figure 10.17, let ZL=100+j150 and Z0=100. Find...Ch. 10 - The lossless line shown in Figure 10.35 is...Ch. 10 - Prob. 10.35PCh. 10 - The two-wire lines shown in Figure 10.36 are all...Ch. 10 - Prob. 10.37PCh. 10 - Repeat Problem 10.37, with, Z0=50 and RL=Rg=25....Ch. 10 - In the transmission line of Figure 10.20, Z0=50,...Ch. 10 - In the charged line of Figure 10.25, the...Ch. 10 - In the transmission line of Figure 10.37, the...Ch. 10 - Figure 10.38 See Problem 10.42. A simple frozen...Ch. 10 - Figure 10.39 See Problem 10.43. In Figure 10.39,...
Knowledge Booster


Learn more about
Need a deep-dive on the concept behind this application? Look no further. Learn more about this topic, electrical-engineering and related others by exploring similar questions and additional content below.Similar questions
- Find the rms value of 7, 10, 13. (Round off to the tenth)arrow_forwardI would like to know the steps to solve the problem to get Equation 10.1.2 in detail, thank you in advance for the answer.arrow_forwardFor the waveform shown, determine: (a) Peak to Peak value (b) Peak value () RMS value (d) Frequency. If volts/div is 3V/div and Time/div is 25ms/div (No need to show the calculations)arrow_forward
- 10) What is the relation between the PSD and the total average power over 1 ?arrow_forwardWe measure and record the instantaneous voltage between the two wires of a power transmission line at arbitrary locations. The measurements at two locations: 0.3m apart. Will the two waveforms be different? If it is different, describe the difference. If so, by how much (negligible to significant).arrow_forward(a) What is the frequency in Hertz and rad/s of the voltage waveform shown on Figure Q1? (b) Calculate the average voltage and rms ac voltage of the waveform shown on Figure Q1. (c) Calculate the total rms voltage of the waveform shown on Figure Q1. (d) The voltage on Figure Q1 is connected across a 0.15 2 resistive load. Calculate the power dissipated in this resistor.arrow_forward
- Connect Figure 10.1 using a 5-volt power supply and 1-k resistor to simulateits internal resistance. Vary the rheostat, RL, in 200-ohm steps up to 2000ohms while recording the voltage values across the internal resistance (RS)and the load resistor (RL). Calculate the remaining values to complete thetable. Circle the row where the maximum power is transferred to the load.arrow_forwardDifferentiate between Distributed Generation (DG) and Distributed Power(DP).arrow_forwardDraw the circuit diagram of Two quadrant chopper which is having average load voltage might be positive or negative. Explain each quadrant operation with neat sketch. I want more than 350 words and I do not want it in handwritingarrow_forward
- Low lagging power factor results in large voltage drop which results in poor.......... . (complete)arrow_forwardQ#5. Illustrate the variation of output power taken from the wind turbine? How the frequency in wind turbine is affected by excessive generation and load? Justify the relationship of frequency with power generation and load?arrow_forwardSubject is Power system Analysis.arrow_forward
arrow_back_ios
SEE MORE QUESTIONS
arrow_forward_ios
Recommended textbooks for you
 Introductory Circuit Analysis (13th Edition)Electrical EngineeringISBN:9780133923605Author:Robert L. BoylestadPublisher:PEARSON
 Delmar's Standard Textbook Of ElectricityElectrical EngineeringISBN:9781337900348Author:Stephen L. HermanPublisher:Cengage Learning
 Programmable Logic ControllersElectrical EngineeringISBN:9780073373843Author:Frank D. PetruzellaPublisher:McGraw-Hill Education
 Fundamentals of Electric CircuitsElectrical EngineeringISBN:9780078028229Author:Charles K Alexander, Matthew SadikuPublisher:McGraw-Hill Education
 Electric Circuits. (11th Edition)Electrical EngineeringISBN:9780134746968Author:James W. Nilsson, Susan RiedelPublisher:PEARSON
 Engineering ElectromagneticsElectrical EngineeringISBN:9780078028151Author:Hayt, William H. (william Hart), Jr, BUCK, John A.Publisher:Mcgraw-hill Education,
Introductory Circuit Analysis (13th Edition)
Electrical Engineering
ISBN:9780133923605
Author:Robert L. Boylestad
Publisher:PEARSON
Delmar's Standard Textbook Of Electricity
Electrical Engineering
ISBN:9781337900348
Author:Stephen L. Herman
Publisher:Cengage Learning
Programmable Logic Controllers
Electrical Engineering
ISBN:9780073373843
Author:Frank D. Petruzella
Publisher:McGraw-Hill Education
Fundamentals of Electric Circuits
Electrical Engineering
ISBN:9780078028229
Author:Charles K Alexander, Matthew Sadiku
Publisher:McGraw-Hill Education
Electric Circuits. (11th Edition)
Electrical Engineering
ISBN:9780134746968
Author:James W. Nilsson, Susan Riedel
Publisher:PEARSON
Engineering Electromagnetics
Electrical Engineering
ISBN:9780078028151
Author:Hayt, William H. (william Hart), Jr, BUCK, John A.
Publisher:Mcgraw-hill Education,
Why Use Bode Plots? | Understanding Bode Plots, Part 1; Author: MATLAB;https://www.youtube.com/watch?v=F6-EaZobHNk;License: Standard Youtube License