
Concept explainers
Videos
Candyland uses
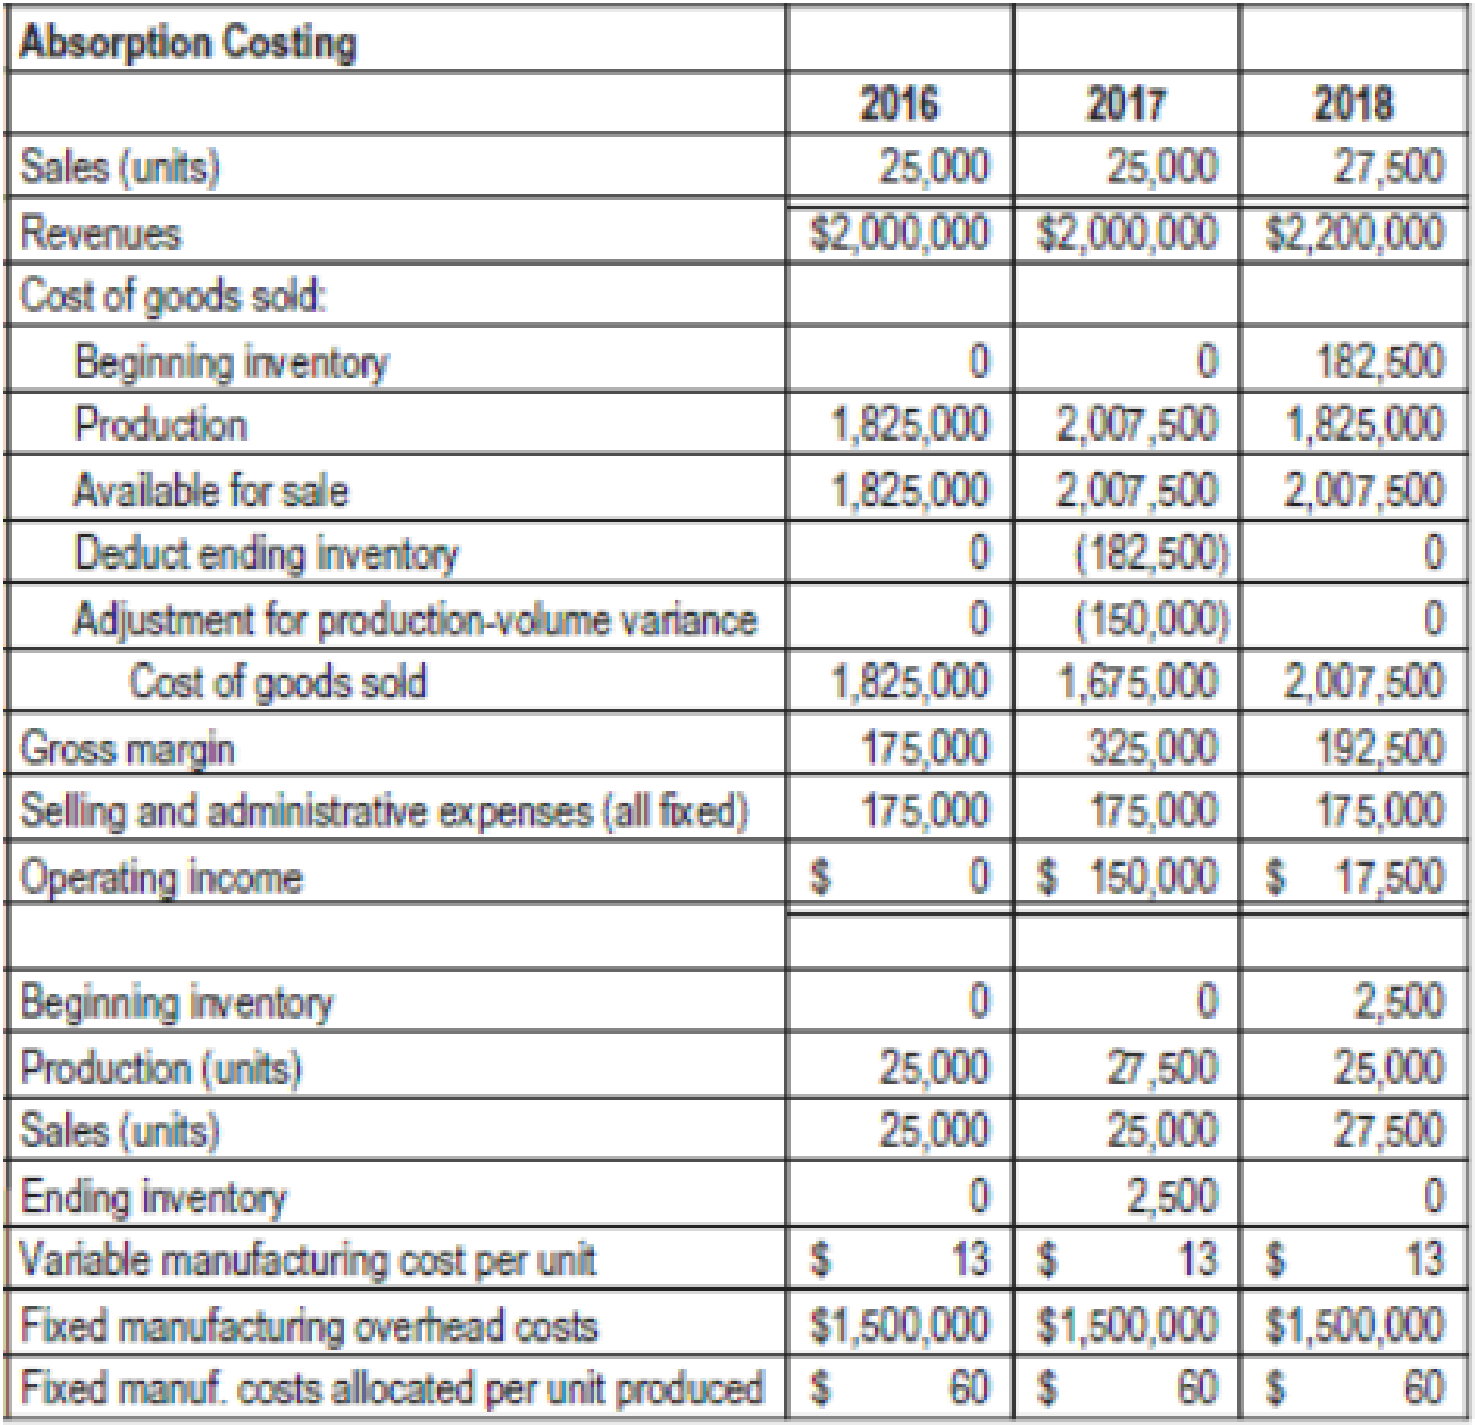
- 1. What denominator level is Candyland using to allocate fixed
manufacturing costs to the candy? How is Candyland disposing of any favorable or unfavorable production-volume variance at the end of the year? Explain your answer briefly. - 2. How did Candyland’s accountants arrive at the breakeven volume of 25,000 units?
- 3. Prepare a variable costing-based income statement for each year. Explain the variation in variable costing operating income for each year based on contribution margin per unit and sales volume.
- 4. Reconcile the operating incomes under variable costing and absorption costing for each year, and use this information to explain to Jack McCay the positive operating income in 2017 and the drop in operating income in 2018.
Want to see the full answer?
Check out a sample textbook solution
Chapter 9 Solutions
Horngren's Cost Accounting: A Managerial Emphasis (16th Edition)


- Luke Corporation produces a variety of products, each within their own division. Last year, the managers at Luke developed and began marketing a new chewing gum, Bubbs, to sell in vending machines. The product, which sells for $5.25 per case, has not had the market success that managers expected and the company is considering dropping Bubbs. The product-line income statement for the past 12 months follows: Revenue $ 14,682,150 Costs Manufacturing costs $ 14,440,395 Allocated corporate costs (@5%) 734,108 15,174,503 Product-line margin $ (492,353 ) Allowance for tax (@20%) 98,470 Product-line profit (loss) $ (393,883 ) All products at Luke receive an allocation of corporate overhead costs, which is computed as 5 percent of product revenue. The 5 percent rate is computed based on the most recent year’s corporate cost as a percentage of revenue. Data on corporate costs and revenues for the past…arrow_forwardAt the beginning of the last quarter of 20x1, Youngston, Inc., a consumer products firm, hired Maria Carrillo to take over one of its divisions. The division manufactured small home appliances and was struggling to survive in a very competitive market. Maria immediately requested a projected income statement for 20x1. In response, the controller provided the following statement: After some investigation, Maria soon realized that the products being produced had a serious problem with quality. She once again requested a special study by the controllers office to supply a report on the level of quality costs. By the middle of November, Maria received the following report from the controller: Maria was surprised at the level of quality costs. They represented 30 percent of sales, which was certainly excessive. She knew that the division had to produce high-quality products to survive. The number of defective units produced needed to be reduced dramatically. Thus, Maria decided to pursue a quality-driven turnaround strategy. Revenue growth and cost reduction could both be achieved if quality could be improved. By growing revenues and decreasing costs, profitability could be increased. After meeting with the managers of production, marketing, purchasing, and human resources, Maria made the following decisions, effective immediately (end of November 20x1): a. More will be invested in employee training. Workers will be trained to detect quality problems and empowered to make improvements. Workers will be allowed a bonus of 10 percent of any cost savings produced by their suggested improvements. b. Two design engineers will be hired immediately, with expectations of hiring one or two more within a year. These engineers will be in charge of redesigning processes and products with the objective of improving quality. They will also be given the responsibility of working with selected suppliers to help improve the quality of their products and processes. Design engineers were considered a strategic necessity. c. Implement a new process: evaluation and selection of suppliers. This new process has the objective of selecting a group of suppliers that are willing and capable of providing nondefective components. d. Effective immediately, the division will begin inspecting purchased components. According to production, many of the quality problems are caused by defective components purchased from outside suppliers. Incoming inspection is viewed as a transitional activity. Once the division has developed a group of suppliers capable of delivering nondefective components, this activity will be eliminated. e. Within three years, the goal is to produce products with a defect rate less than 0.10 percent. By reducing the defect rate to this level, marketing is confident that market share will increase by at least 50 percent (as a consequence of increased customer satisfaction). Products with better quality will help establish an improved product image and reputation, allowing the division to capture new customers and increase market share. f. Accounting will be given the charge to install a quality information reporting system. Daily reports on operational quality data (e.g., percentage of defective units), weekly updates of trend graphs (posted throughout the division), and quarterly cost reports are the types of information required. g. To help direct the improvements in quality activities, kaizen costing is to be implemented. For example, for the year 20x1, a kaizen standard of 6 percent of the selling price per unit was set for rework costs, a 25 percent reduction from the current actual cost. To ensure that the quality improvements were directed and translated into concrete financial outcomes, Maria also began to implement a Balanced Scorecard for the division. By the end of 20x2, progress was being made. Sales had increased to 26,000,000, and the kaizen improvements were meeting or beating expectations. For example, rework costs had dropped to 1,500,000. At the end of 20x3, two years after the turnaround quality strategy was implemented, Maria received the following quality cost report: Maria also received an income statement for 20x3: Maria was pleased with the outcomes. Revenues had grown, and costs had been reduced by at least as much as she had projected for the two-year period. Growth next year should be even greater as she was beginning to observe a favorable effect from the higher-quality products. Also, further quality cost reductions should materialize as incoming inspections were showing much higher-quality purchased components. Required: 1. Identify the strategic objectives, classified by the Balanced Scorecard perspective. Next, suggest measures for each objective. 2. Using the results from Requirement 1, describe Marias strategy using a series of if-then statements. Next, prepare a strategy map. 3. Explain how you would evaluate the success of the quality-driven turnaround strategy. What additional information would you like to have for this evaluation? 4. Explain why Maria felt that the Balanced Scorecard would increase the likelihood that the turnaround strategy would actually produce good financial outcomes. 5. Advise Maria on how to encourage her employees to align their actions and behavior with the turnaround strategy.arrow_forwardShannon, Inc., has two divisions. One produces and sells paper party supplies (napkins, paper plates, invitations); the other produces and sells cookware. A segmented income statement for the most recent quarter is given below: On seeing the quarterly statement, Madge Shannon, president of Shannon, Inc., was distressed and discussed her disappointment with Bob Ferguson, the companys vice president of finance. MADGE: The Party Supplies Division is killing us. Its not even covering its own fixed costs. Im beginning to believe that we should shut down that division. This is the seventh consecutive quarter it has failed to provide a positive segment margin. I was certain that Paula Kelly could turn it around. But this is her third quarter, and she hasnt done much better than the previous divisional manager. BOB: Well, before you get too excited about the situation, perhaps you should evaluate Paulas most recent proposals. She wants to spend 10,000 per quarter for the right to use familiar cartoon figures on a new series of invitations, plates, and napkins and at the same time increase the advertising budget by 25,000 per quarter to let the public know about them. According to her marketing people, sales should increase by 10 percent if the right advertising is doneand done quickly. In addition, Paula wants to lease some new production machinery that will increase the rate of production, lower labor costs, and result in less waste of materials. Paula claims that variable costs will be reduced by 30 percent. The cost of the lease is 95,000 per quarter. Upon hearing this news, Madge calmed considerably and, in fact, was somewhat pleased. After all, she was the one who had selected Paula and had a great deal of confidence in Paulas judgment and abilities. Required: 1. Assuming that Paulas proposals are sound, should Madge Shannon be pleased with the prospects for the Party Supplies Division? Prepare a segmented income statement for the next quarter that reflects the implementation of Paulas proposals. Assume that the Cookware Divisions sales increase by 5 percent for the next quarter and that the same cost relationships hold. 2. Suppose that everything materializes as Paula projected except for the 10 percent increase in salesno change in sales revenues takes place. Are the proposals still sound? What if the variable costs are reduced by 40 percent instead of 30 percent with no change in sales?arrow_forward
- Millard Corporation is a wholesale distributor of office products. It purchases office products from manufacturers and distributes them in the West, Central, and East regions. Each of these regions is about the same size and each has its own manager and sales staff. The company has been experiencing losses for many months. In an effort to improve performance, management has requested that the monthly income statement be segmented by sales region. The company's first effort at preparing a segmented income statement for May is given below. Sales Regional expenses (traceable): Cost of goods sold Advertising Salaries Utilities Depreciation Shipping expense Total regional expenses Regional income (loss) before corporate expenses Corporate expenses: Advertising (general) General administrative expense Total corporate expenses Net operating income (loss) West $ 312,000 94,000 100,000 56,000 8,600 25,000 16,000 299,600 12,400 13,000 20,000 33,000 $ (20,600) Sales Region Central $ 796,000…arrow_forwardMillard Corporation is a wholesale distributor of office products. It purchases office products from manufacturers and distributes them in the West, Central, and East regions. Each of these regions is about the same size and each has its own manager and sales staff. The company has been experiencing losses for many months. In an effort to improve performance, management has requested that the monthly income statement be segmented by sales region. The company's first effort at preparing a segmented income statement for May is given below. Sales Regional expenses (traceable): Cost of goods sold Advertising Salaries Utilities Depreciation Shipping expense Total regional expenses Regional income (loss) before corporate expenses Corporate expenses: Advertising (general) General administrative expense Total corporate expenses Net operating income (loss) Variable expenses: Total variable expenses Traceable fixed expenses: Total traceable fixed expenses Common fixed expenses: Total common…arrow_forwardMillard Corporation is a wholesale distributor of office products. It purchases office products from manufacturers and distributes them in the West, Central, and East regions. Each of these regions is about the same size and each has its own manager and sales staff. The company has been experiencing losses for many months. In an effort to improve performance, management has requested that the monthly income statement be segmented by sales region. The company’s first effort at preparing a segmented income statement for May is given below. Sales Region West Central East Sales $ 311,000 $ 796,000 $ 703,000 Regional expenses (traceable): Cost of goods sold 94,000 240,000 312,000 Advertising 105,000 236,000 240,000 Salaries 54,000 54,000 107,000 Utilities 8,700 16,100 13,600 Depreciation 21,000 35,000 28,000 Shipping expense 17,000 31,000 36,000 Total regional expenses 299,700 612,100 736,600 Regional income (loss) before corporate expenses 11,300…arrow_forward
- Millard Corporation is a wholesale distributor of office products. It purchases office products from manufacturers and distributes them in the West, Central, and East regions. Each of these regions is about the same size and each has its own manager and sales staff. The company has been experiencing losses for many months. In an effort to improve performance, management has requested that the monthly income statement be segmented by sales region. The company's first effort at preparing a segmented income statement for May is given below. Sales Regional expenses (traceable): Cost of goods sold Advertising Salaries Utilities Depreciation Shipping expense Total regional expenses Regional income (loss) before corporate expenses Corporate expenses: Advertising (general) General administrative expense Total corporate expenses Net operating income (loss) Variable expenses: Total variable expenses Traceable fixed expenses: Total traceable fixed expenses Common fixed expenses: Total common…arrow_forwardMillard Corporation is a wholesale distributor of office products. It purchases office products from manufacturers and distributes them in the West, Central, and East regions. Each of these regions is about the same size and each has its own manager and sales staff The company has been experiencing losses for many months. In an effort to improve performance, management has requested that the monthly income statement be segmented by sales region. The company's first effort at preparing a segmented income statement for May is given below. Sales Regional expenses traceable): Cost of goods sold Advertising Salaries Utilities Depreciation Shipping expense Total regional expenses Regional income (less) before corporate expenses Corporate expenses Advertising (general) General administrative expense Mest $311,000 92,000 110,000 59,000 8.900 25,000 15,000 309,900 1.100 14,000 20,000 34,000 5 (32,900) Sales Region Central $800,000 245,000 245,000 59,000 15,500 33,000 28,000 hiso 2 East…arrow_forwardIn 20X1, LLHC sold for $2,400 per ton, making it one of the most profitable products. A similar examination of some of the other low-volume products revealed that they also had very respectable profit margins. Unfortunately, the performance of the high-volume products was less impressive, with many showing losses or very low-profit margins. This situation led Ryan Chesser to call a meeting with his marketing vice president, Jennifer Woodruff, and his controller, Kaylin Penn. Ryan: The above-average profitability of our low-volume specialty products and the poor profit performance of our high-volume products make me believe that we should switch our marketing emphasis to the low-volume line. Perhaps we should drop some of our high-volume products, particularly those showing a loss. Jennifer: I’m not convinced that solution is the right one. I know our high-volume products are of high quality, and I’m convinced that we are as efficient in our production as other firms. I think that…arrow_forward
- Supermart Food Stores (SFS) has experienced net operating losses in its frozen food products line in the last few periods. Management believes that the store can improve its profitability if SFS discontinues frozen foods. The operating results from the most recent period are: Order processing Receiving Shelf-stocking Customer support Sales Cost of goods sold SFS estimates that store support expenses, in total, are approximately 20% of revenues. The controller says that not every sales dollar requires or uses the same amount of store support activities. A preliminary analysis reveals store support activities for these three product lines are: Frozen Foods $ 120,000 185,000 Activity (cost driver) Order processing (number of purchase orders) Receiving (number of deliveries) Shelf-stocking (number of hours per delivery) Customer support (total units sold) The controller estimates activity-cost rates for each activity as follows: $ 88 per purchase order 110 per delivery per hour per item…arrow_forwardWindows is a small company that installs windows. Its cost structure is as follows: LOADING... (Click the icon to view the cost structure.) Traylor Windows' breakeven revenues is $1,870,000 and breakeven units is 3,400. Calculate the margin of safety in units and dollars and the margin of safety percentage if Traylor Windows expects to sell 3,600 windows in the year. Begin with calculating the margin of safety in dollars. Determine the formula to calculate the margin of safety in dollars. Then, enter the amounts and calculate the margin of safety in dollars. Budgeted revenue - Breakeven revenue = Margin of safety in dollars - = Next, determine the formula, enter the amounts, and calculate the margin of safety in units. Budgeted units - Breakeven units = Margin of safety in units - = Finally, calculate the margin of safety percentage if…arrow_forwardWeston Corporation manufactures a product that is available in both a deluxe and a regular model. The company has made the regular model for years; the deluxe model was introduced several years ago to tap a new segment of the market. Since introduction of the deluxe model, the company’s profits have steadily declined. Sales of the deluxe model have been increasing rapidly. Overhead is applied to products on the basis of direct labor-hours. At the beginning of the current year, management estimated that $3,080,000 in overhead costs would be incurred and the company would produce and sell 10,000 units of the deluxe model and 50,000 units of the regular model. The deluxe model requires 2.0 hours of direct labor time per unit, and the regular model requires 1.0 hours. Materials and labor costs per unit are given below: Deluxe Regular…arrow_forward
 Cornerstones of Cost Management (Cornerstones Ser...AccountingISBN:9781305970663Author:Don R. Hansen, Maryanne M. MowenPublisher:Cengage Learning