
Concept explainers
Videos
INTERPRET DATA Examine the top and middle graphs in Figure 54-5. Are these examples of exponential or
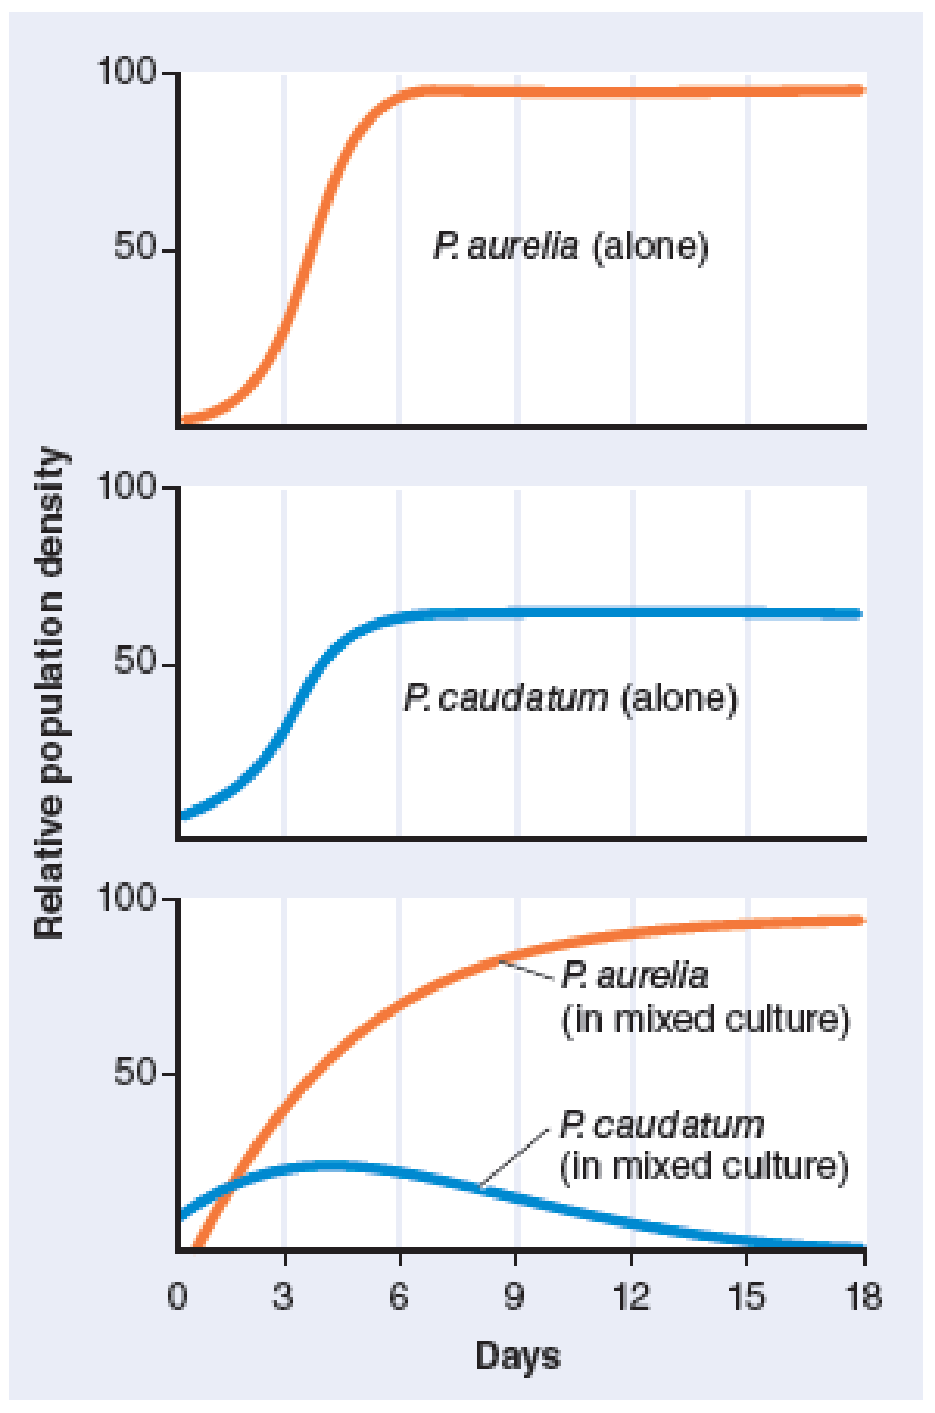
RESULTS AND CONCLUSION: The top and middle graphs show how each species of Paramecium flourishes when grown alone. The bottom graph shows how they grow together, in competition with each other. In a mixed culture, P. aurelia outcompetes P. caudatum, resulting in competitive exclusion.
SOURCE: Adapted from G.F. Gause, The Struggle for Existence (Williams and Wilkins, Baltimore, 1934).
Figure 54-5 G.F. Gause’s classic experiment on interspecific competition

Trending nowThis is a popular solution!

Chapter 54 Solutions
Biology (MindTap Course List)
Additional Science Textbook Solutions
Genetics: Analysis and Principles
Study Guide for Campbell Biology
Microbiology with Diseases by Body System (5th Edition)
Anatomy & Physiology
Microbiology: Principles and Explorations


- A mess of 40 iguanas moved to a new island which is so large that the carrying capacity is essentially non-existent. The growth rate for these island iguanas was 0.6 and they have a generation time of 2 years. How many iguanas do you expect to find on the island after 6 years? (Show your work. Round your final answer to the nearest whole iguana and clearly indicate your final answer).arrow_forwardWrite a generalized model for exponential population growth. Define your terms. Then, draw a plot showing an example, being sure to label your axes. Write a formula that extends the preceding model to incorporate carrying capacity, producing sigmoidal population growth. Define your terms. Then, draw a plot showing an example, being sure to label your axes.arrow_forwardConsider two species A and 8, with natural growth rates rA = 2 and re = 4 respectively, and natural carrying capacities MA = 600 and MB = 20, respectively. Suppose the species interact so that e = 0.5 and eg = 0.1. (a) If the species interact according to competition: (Give your answers correct to at least two decimal places.) The interesting equilibrium occurs when A = and B = If the initial populations are A(0) = 2 and B(0) = 1, one of the two species eventually dominates. Which one? O Species A O Species B !3! What is the long-term population of this dominant species? (Give your answer correct to the nearest integer.) (b) If the species interact according to symbiosis: (Give your answers correct to the nearest integer.) The interesting equilibrium occurs when A= and 8- If the initial populations are A(0) - 39 and B(0) = 4, what happens? O one species dies off O both species die off O both species survive (c) If the species interact according to commensalism: (Give your answers…arrow_forward
- These data were collected over a 5-year period for a perennial compass plant. What is the rate of growth of the population if the carrying capacity is 1000 (using 202 for starting population size)? What is the fastest rate of growth possible for this population?arrow_forwardAssume a population of desert tortoises has a per capita growth rate (r) or 0.039. If this rate could be sustained, how long would it take for the population that is currently 186 individuals to reach 450 individuals? (just give the simplest expression with the data provided). Edit View Insert Format Tools Table 12pt Paragraph BIU AT²arrow_forwardThe three types of curves are also described as: early loss, late loss, and constant loss. Propose an organism that would have a Type 2 curve. Defend your choice by describing this animal's life pattern using the data and growth curve as a guide. (If you are really stuck, use google to look up survivorship curves)arrow_forward
- Contrast exponential and logistic (= sigmoid) growth of a population. Under what conditions might you expect a population to exhibit ex-ponential growth? Why can exponential growth not be perpetuated indefinitely?arrow_forwardShow how you build the logistic model for population growth from the exponential model equation? What part of the logistic growth equation produces the sigmoidal growth curve?arrow_forwardGeometric growth refers to the growth of populations that do not have overlap in their generations. Annual plants and some insects are good examples where adults die before young individuals mature to reproduce. Pacific salmon are an example of a vertebrate with geometric growth because spawning (egg laying). The equation for geometric growth is: N=2 No; where 2= finite rate of increase and t=number of time intervals. Question A1. Calculate the population size after 10 time intervals (N10) if No = 120 and 2 = 1.1. Question A2. If N1 =750 and N2 = 890, calculate 2arrow_forward
- Suppose there are two different populations of deer that grow exponentially over a period of 20 years. One population has a growth rate (r) of 0.44, and the other population has a growth rate (r) of 0.46. Is the statement below true or false? There will not be much difference in the size (N) of these two populations after 20 years of exponential growth. True O False MacBook Pro G Search or type URL &1 3- LCarrow_forwardAphids and ants can have a mutualistic relationship. Aphids exude sugary substances that provide energy for ants and ants can defend aphid colonies from predators. This experiment measured the population growth rate of aphids vs the number of aphids at the start of the experiment on plants where ants were present or absent. Please select all the statements that are reasonable interpretations of this graph. Select all that apply. A. When starting populations are low, the presence of ants does not matter. Their importance increases with higher starting population densities. B. It appears that aphid populations founded with 12 individuals grow faster than aphid populations founded with 24 individuals when compared to each other in the same ant treatment.. C. none of the above. D. The growth of rate of aphid populations was significantly higher when tended by ants than aphid population that were not tended E. Ants seem to be necessary for small founding populations of…arrow_forwardIn the development of the exponential model of population growth, why can B and D be substituted by bN and dN, respectively? Explain.arrow_forward
 Biology (MindTap Course List)BiologyISBN:9781337392938Author:Eldra Solomon, Charles Martin, Diana W. Martin, Linda R. BergPublisher:Cengage Learning