
Concept explainers
Videos
Acrylamide is a chemical that is sometimes found in cooked starchy foods and which is thought to increase the risk of certain kinds of cancer. The paper “A Statistical Regression Model for the Estimation of Acrylamide Concentrations in French Fries for Excess Lifetime Cancer Risk Assessment” (Food and Chemical Toxicology [2012]: 3867–3876) describes a study to investigate the effect of frying time (in seconds) and acrylamide concentration (in micrograms per kilogram) in French fries. The data in the accompanying table are approximate values read from a graph that appeared in the paper.
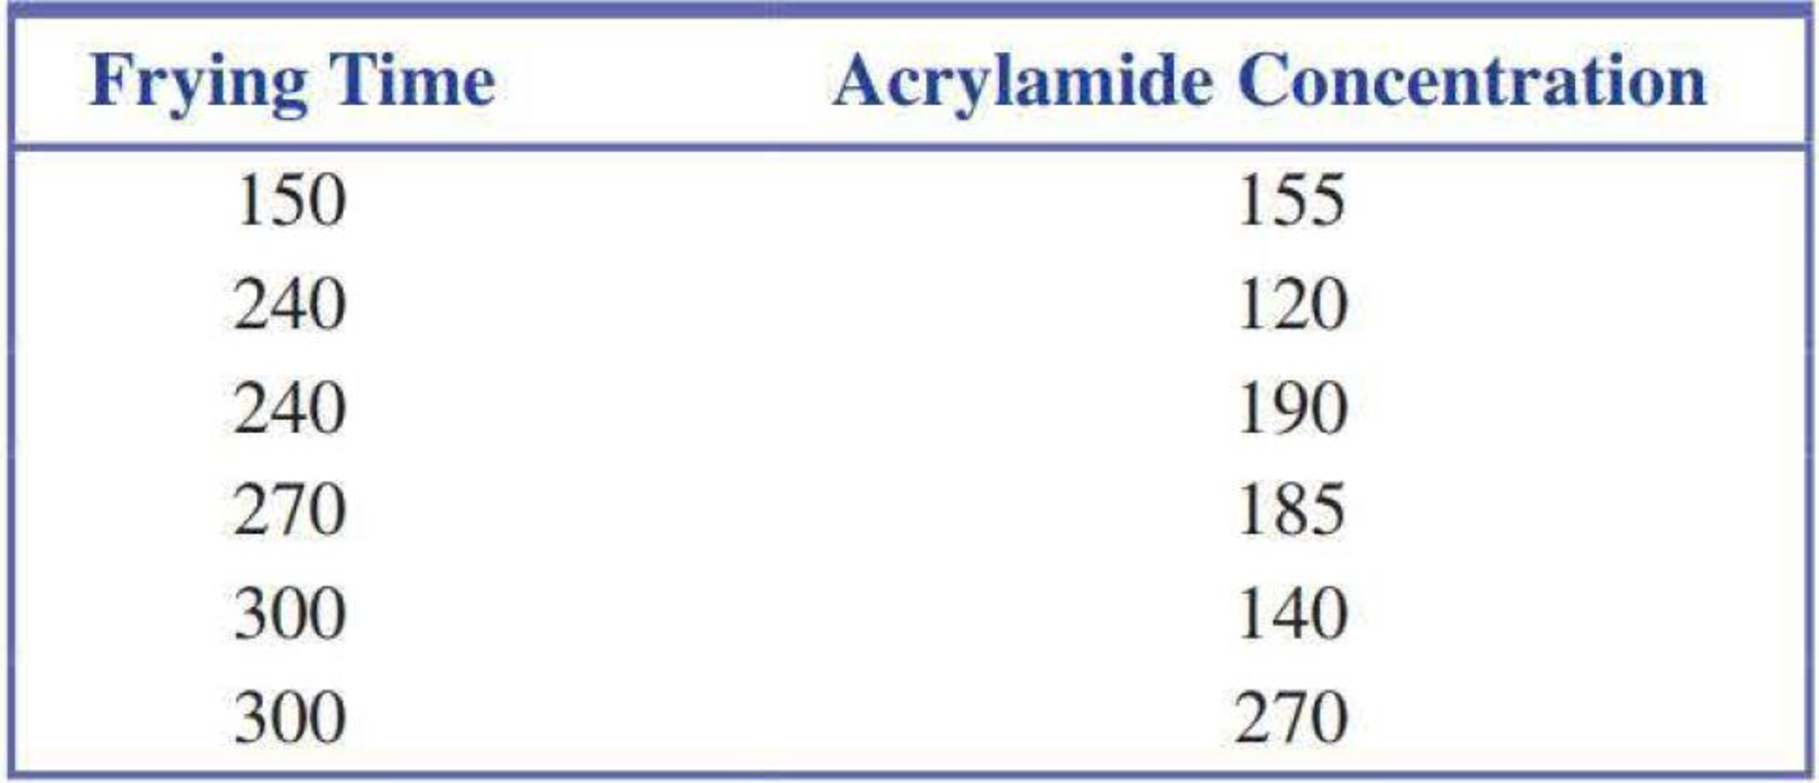
- a. If the goal is to learn how acrylamide concentration is related to frying time, which of these two variables is the dependent variable and which is the independent variable?
- b. Construct a
scatterplot of these data. Describe any interesting features of the scatterplot.

Trending nowThis is a popular solution!

Chapter 5 Solutions
Introduction To Statistics And Data Analysis
Additional Math Textbook Solutions
Elementary Statistics
The Practice of Statistics for AP - 4th Edition
Statistics: Informed Decisions Using Data (5th Edition)
Probability and Statistics for Engineering and the Sciences
Applied Statistics in Business and Economics
Elementary Statistics ( 3rd International Edition ) Isbn:9781260092561


- Acrylamide is a chemical that is sometimes found in cooked starchy foods and which is thought to increase the risk of certain kinds of cancer. The paper "A Statistical Regression Model for the Estimation of Acrylamide Concentrations in French Fries for Excess Lifetime Cancer Risk Assessment"+ describes a study to investigate the effect of frying time (in seconds) and acrylamide concentration (in micrograms per kilogram) in french fries. The data in the accompanying table are approximate values read from a graph that appeared in the paper. Frying Acrylamide Time Concentration 150 240 240 270 300 300 150 125 + 195 185 135 275 USE SALT (a) Find the equation of the least-squares line for predicting acrylamide concentration using frying time. (Round your answers to four decimal places.) ŷ = (b) Does the equation of the least-squares line support the conclusion that longer frying times tend to be paired with higher acrylamide concentrations? Explain. O No, the least squares regression line…arrow_forwardAcrylamide is a chemical that is sometimes found in cooked starchy foods and which is thought to increase the risk of certain kinds of cancer. The paper "A Statistical Regression Model for the Estimation of Acrylamide Concentrations in French Fries for Excess Lifetime Cancer Risk Assessment"+ describes a study to investigate the effect of frying time (in seconds) and acrylamide concentration (in micrograms per kilogram) in french fries. The data in the accompanying table are approximate values read from a graph that appeared in the paper. Frying Acrylamide Time Concentration 150 240 240 270 300 300 150 + 115 190 180 145 275 (a) Find the equation of the least-squares line for predicting acrylamide concentration using frying time. (Round your answers to four decimal places.) ŷ = (b) Does the equation of the least-squares line support the conclusion that longer frying times tend to be paired with higher acrylamide concentrations? Explain. No, the least squares regression line equation…arrow_forwardA researcher is using a panel data set on n = 1000 workers over T = 10 years (from 2001 through 2010) that contains the workers' earnings, gender, education, and age. The researcher is interested in the effect of education on earnings. Suppose you run a regression of earnings on person-specific and time-specific control variables. Can this regression be used to estimate the effect of gender on an individual's earnings or the effect of the national unemployment rate on an individual's earnings? A. Neither effect can be estimated using this regression. B. It can be used to estimate the effect of both gender and the national unemployment rate on an individual's earnings C. It can be used to estimate the effect of gender on an individual's earnings, but not the effect of the national unemployment rate on an individual's earnings. D. It can be used to estimate the effect of the national unemployment rate on an individual's earnings, but not the effect of gender on an individual's earnings.arrow_forward
- A medical student at a community college in city Q wants to study the factors affecting the systolic blood pressure of a person (Y) Generally, the systolic blood pressure depends on the BMI of a person (B) and the age of the person A. She wants to test whether or not the BMI has a significant effect on the systolic blood pressure, keeping the age of the person constant. For her study, she collects a random sample of 125 patients from the city and estimates the following regression function: Y= 15.50 + 0..90B+1.15A. (0.55) (0 40) The test statistic of the study the student wants to conduct (Ho: B, = 0 vs. H, B, #0), keeping other variables constant is. (Round your answer to two decimal places.) At the 5% significance level, the student will ▼ the null hypothesis. Keeping BMIl constant, she now wants to test whether the age of a person (A) has no significant effect or a positive effect on the person's systolic blood pressure. So, the test statistic associated with the one-sided test the…arrow_forwardA methodological study had established values for the MIC on a scale that measured physical function: The MIC for improvement (higher scores) was 4.0, and the MIC for deterioration (lower scores) was 3.0. Lawrence studied clinically significant change in physical functioning over a 1-year period for a sample of 100 patients with COPD. Some change score information is presented below for 10 patients. Which patients experienced clinically significant change in physical function in the 12-month period between assessments? Patient Baseline Score* 12-Month Score* 1 19 15 2 12 10 3 16 14 4 17 16 5 9 10 6 11 12 7 13 17 8 15 13 9 18 14 10 16 9 *Higher scores = higher level of physical function Which patients had clinically significant deterioration? Which patients had clinically significant improvement? Which patients had no clinically significant change?arrow_forwardAnemia (low healthy blood cells or hemoglobin) has an important role in exercise performance. However, the direct link between rapid changes of hemoglobin and exercise performance is still unknown. A study investigated 18 patients with a blood disorder (beta-thalassemia). Participants in the study performed an exercise test before and the day after receiving a blood transfusion. Data are given in the table. HB = Hemoglobin RER = Respiratory exchange ID Change in HB Obese RER > 1.1 ratio No No 1 -1.4 No -1.5 No Yes No Yes 3 -2 No 4 -2.1 No -1.9 Yes Yes No -1.6 -1.8 -0.8 6 7 No Yes No Yes 8 9. -1 No No -1.2 No Yes 10 11 No No -0.8 -1.5 12 Yes No No Yes 13 14 -1.4 -2.6 -1.7 No No Yes Yes 15 Yes No Yes Yes 16 -2.6 No 17 18 -2.7 -1.5 Noarrow_forward
- 2. A study is conducted in patients with HIV. The primary outcome is CD4 cell count which is a measure of the stage of the disease. Lower CD4 counts are associated with more advanced disease. The investigators are interested in the association between vitamin and mineral supplements and CD4 count. A multiple regression analysis is performed relating CD4 count to use of supplements (coded as 1=yes, 0=no) and to duration of HIV, in years (i.e., the number of years between the diagnosis of HIV and the study date). For the analysis, Y=CD4 count.Y = 501.41 + 12.67 Supplements – 30.23 Duration of HIVA. What is the expected CD4 count for a patient taking supplements who has had HIV for 2.5 years?Y = 438.505B. What is the expected CD4 count for a patient not taking supplements who was diagnosed with HIV at study enrollment?Y = 471.18C. What is the expected CD4 count for a patient not taking supplements who has had HIV for 2.5 years.= 425.835I would like to know if calculated correctly.…arrow_forwardTardigrades, or water bears, are a type of micro-animal famous for their resilience. In examining the effects of radiation on organisms, an expert claimed that the amount of gamma radiation needed to sterilize a colony of tardigrades no longer has a mean of 1150 Gy (grays). (For comparison, humans cannot withstand more than 10 Gy.) A random sample of 25 tardigrade colonies found that the amount of gamma radiation needed to sterilize a colony had a sample mean of 1133 Gy, with a sample standard deviation of 62 Gy. Assume that the population of amounts of gamma radiation needed to sterilize a colony of tardigrades is approximately normally distributed. Complete the parts below to perform a hypothesis test to see if there is enough evidence, at the 0.05 level of significance, to support that u, the mean amount of gamma radiation needed to sterilize a colony of tardigrades, is not equal to 1150 Gy. (a) State the null hypothesis H, and the alternative hypothesis H, that you would use for…arrow_forwardDefine the ADL and GLS Estimators of Regression.arrow_forward
 Calculus For The Life SciencesCalculusISBN:9780321964038Author:GREENWELL, Raymond N., RITCHEY, Nathan P., Lial, Margaret L.Publisher:Pearson Addison Wesley,
 Linear Algebra: A Modern IntroductionAlgebraISBN:9781285463247Author:David PoolePublisher:Cengage Learning
 Glencoe Algebra 1, Student Edition, 9780079039897...AlgebraISBN:9780079039897Author:CarterPublisher:McGraw Hill
 Big Ideas Math A Bridge To Success Algebra 1: Stu...AlgebraISBN:9781680331141Author:HOUGHTON MIFFLIN HARCOURTPublisher:Houghton Mifflin Harcourt