
Videos
a.
Draw the
a.
Answer to Problem 86E
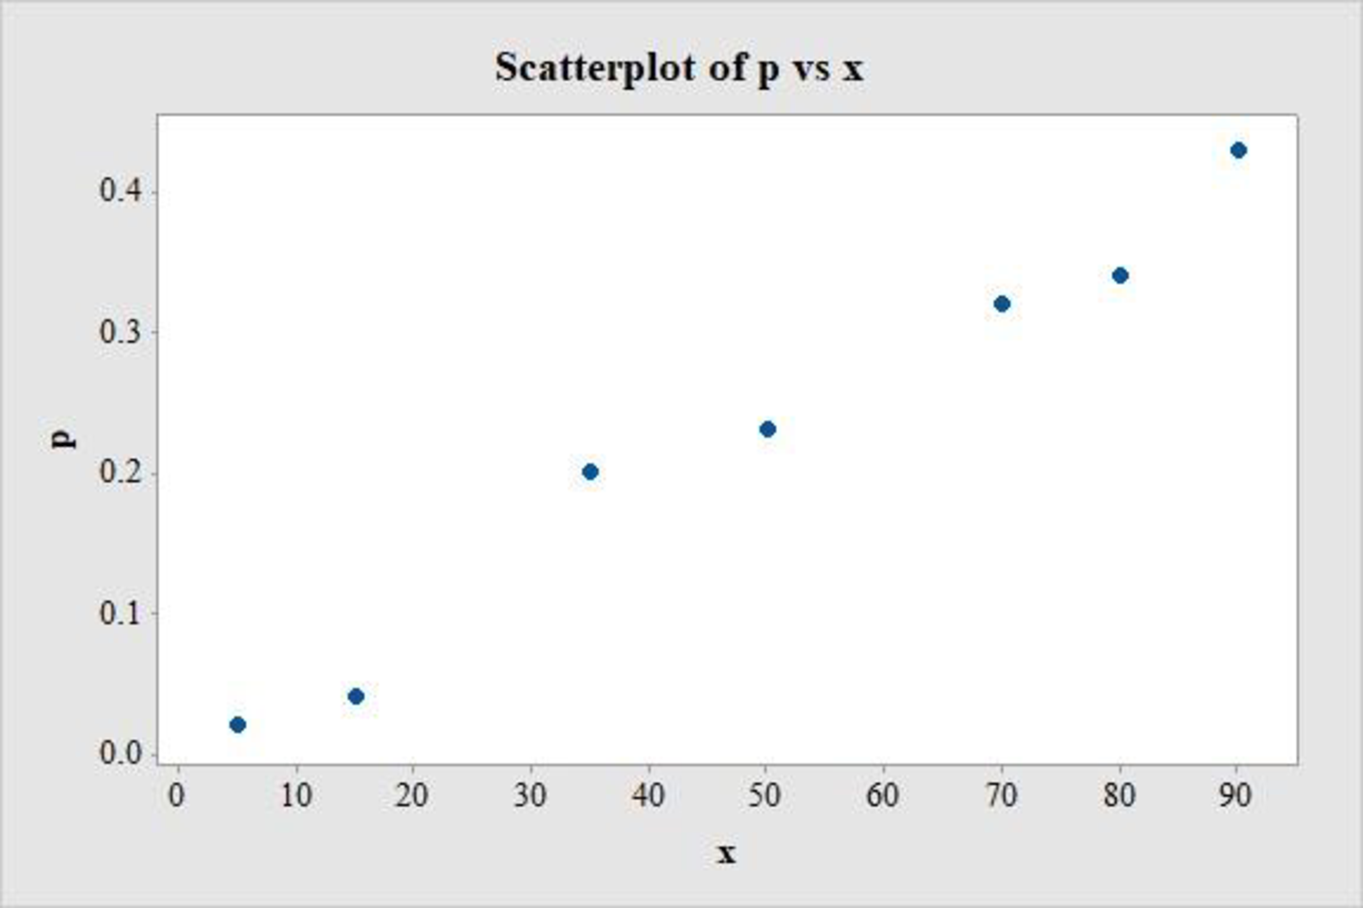
The scatterplot of the proportion of failing versus the load on the fabric is as follows:
Explanation of Solution
Calculation:
The given data relates the proportion of times a fabric fails, or causes a “wardrobe malfunction” with the load or force applied on it (lb/sq in.).
Denote the proportion of times a fabric fails as p and the load as x.
Scatterplot:
Software procedure:
Step-by-step procedure to draw the scatterplot using MINITAB software is given below:
- Choose Graph > Scatterplot.
- Choose Simple, and then click OK.
- Enter the column of p under Y variables.
- Enter the column of x under X variables.
- Click OK in all dialogue boxes.
Thus, the scatterplot for the data is obtained.
b.
Find the value of
Fit a regression line of the form
Describe the significance of the positive slope.
b.
Answer to Problem 86E
The regression line fitted to the given data is
Explanation of Solution
Calculation:
Logistic regression:
The logistic regression equation for the prediction of a probability for the given value of the explanatory variable, x, is
The values of
Data transformation
Software procedure:
Step-by-step procedure to transform the data using MINITAB software is given below:
- Choose Calc > Calculator.
- Enter the column of y* under Store result in variable.
- Enter the formula LN(‘p’/(1–‘p’)) under Expression.
- Click OK.
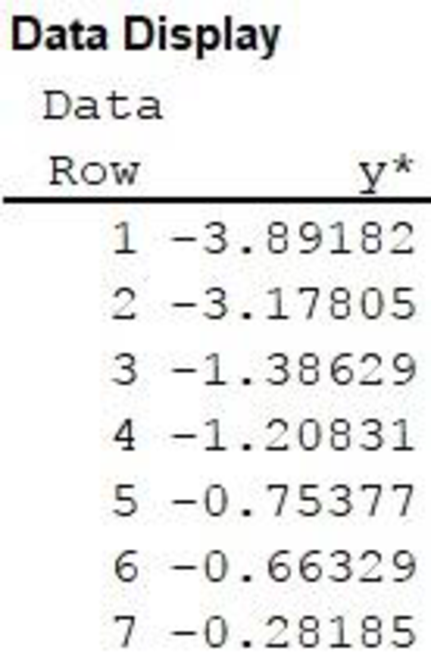
The transformed variable is stored in the column y*.
Data display:
Software procedure:
Step by step procedure to display the data using MINITAB software is given as,
- Choose Data > Display Data.
- Under Column, constants, and matrices to display, enter the column of y*.
- Click OK on all dialogue boxes.
The output using MINITAB software is given as follows:
Regression equation:
Software procedure:
Step by step procedure to obtain the regression equation using the MINITAB software:
- Choose Stat > Regression > Regression > Fit Regression Model.
- Enter the column of y* under Responses.
- Enter the columns of x under Continuous predictors.
- Choose Results and select Analysis of Variance, Model Summary, Coefficients, Regression Equation.
- Click OK in all dialogue boxes.
Output obtained using MINITAB is given below:
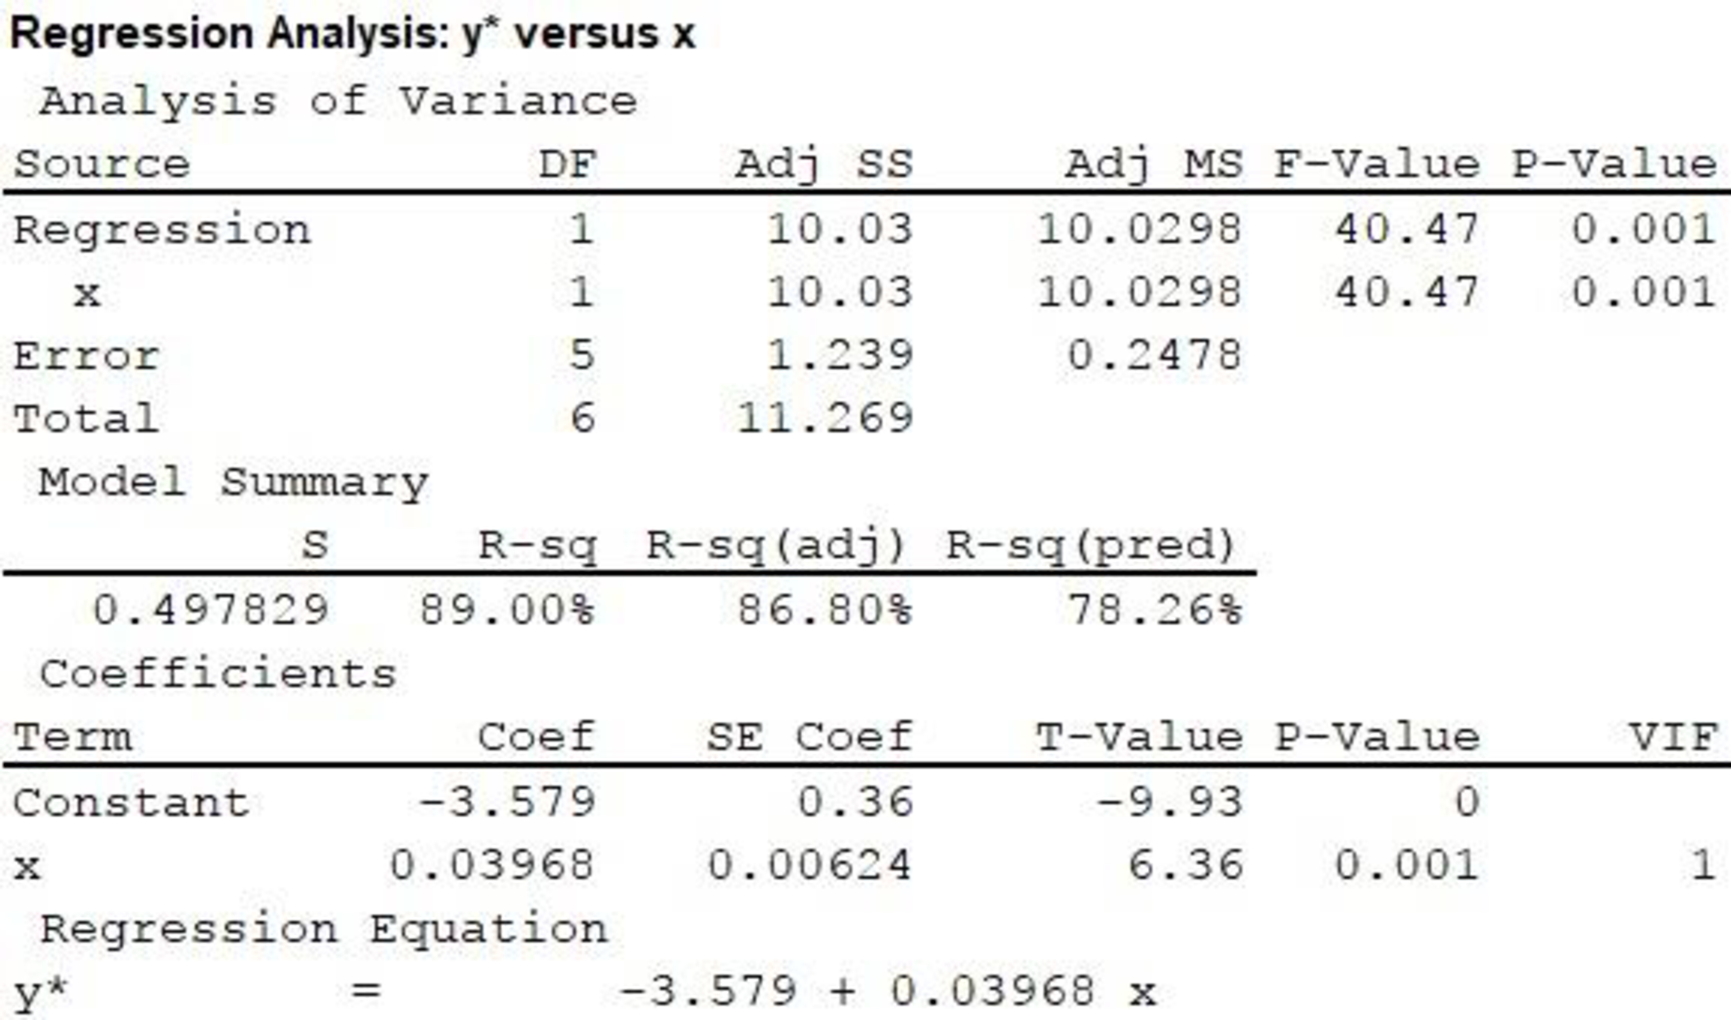
In the output, substituting
It is observed that the slope of x is 0.03968, which is positive. A positive slope implies that an increase in x causes an increase in yꞌ.
Now, it is known that the quantity
In this case, an increase in load increases the natural logarithm of odds of failure, which, in turn, implies an increase in the odds of failure.
Thus, the positive slope implies that an increase in load causes an increase in the odds of failure of a fabric.
c.
Predict the proportion of failure of a fabric, for a load of 60 lb/sq in.
c.
Answer to Problem 86E
The proportion of failure of a fabric, for a load of 60 lb/sq in. is 0.2318.
Explanation of Solution
Calculation:
For a load of 60 lb/sq in., substitute
Thus,
Thus, the proportion of failure of a fabric, for a load of 60 lb/sq in. is 0.2318.
d.
Estimate the maximum safe load to have a less than 5% chance of failing or wardrobe malfunction.
d.
Answer to Problem 86E
The maximum safe load to have a less than 5% chance of failing or wardrobe malfunction is 16 lb/sq in.
Explanation of Solution
Calculation:
For a 5% chance of failing,
Thus,
As a result, the load for a proportion of failure of 0.05 is 16 lb/sq in.
Now, from the explanation in Part b, an increase in the load causes an increase in the odds of failure. Thus, an increase in load from 16 lb/sq in. would cause an increase in the proportion of failure, whereas a decrease in load from 16 lb/sq in. would cause a decrease in the proportion of failure.
Thus, the maximum safe load to have a less than 5% chance of failing or wardrobe malfunction is 16 lb/sq in.
Want to see more full solutions like this?
Chapter 5 Solutions
Introduction To Statistics And Data Analysis


- A sociologist wants to determine if the life expectancy of people in Africa is less than the life expectancy of people in Asia. The data obtained is shown in the table below. Africa Asia = 63.3 yr. 1 X,=65.2 yr. 2 o, = 9.1 yr. = 7.3 yr. n1 = 120 = 150arrow_forwardOne operation of a mill is to cut pieces of steel into parts that will later be used as the frame for front seats in an automobile. The steel is cut with a diamond saw and requires the resulting parts to be within 10.005 inch of the length specified by the automobile company. Data are collected from a sample of 50 steel parts and are shown in the following table. The measurement reported is the difference in inches between the actual length of the steel part, as measured by a laser measurement device, and the specified length of the steel part. For example, the first value, -0.003, represents a steel part that is 0.003 inch shorter than the specified length. Complete parts a through c Click the icon to view the data table. a. Construct a frequency distribution Difference in Length -0.005 but less than -0.003: -0.003but less than -0.001 -0.001but less than 0.001 0.001but less than 0.003 0.003but less than 0.005 Frequency Difference Between Actual and Specified Lengths 0.002 0 -0.003…arrow_forwardAn engineer who accidentally inhaled poisonous fumes was given treatment for it. The concentration of poison in the engineer's blood was measured every hour. The table below shows the record: Hours Since Inhal ati on 1 5 Concentration 38.1 31.2 28.6 26.9 25.4 ug/ cm) The data in the table can be modelled by h = a +b lIn C, where h is the number of hours since the accident and C is the concentration of poison in the blood. If the engineer is allowed to return to work when the concentration of poison falls below 0.2, how many days must they wait to return to work? (Round your answer UP to the nearest day). Answer: 3. 2.arrow_forward
- In an experiment to investigate oxide charge, Qax on a silicon wafer. The factors thought to induce oxide charge, Qax are cleaning steps and the test location on the wafer where the charge was measured. The results summarized in Table 5. Table 5 Test Location Oxide Charge, Qox Cleaning Method Right (R) Left (L) (x 10" q/cm?) 1.66 R 1.62 1.90 Complete Spin-Rinse-Dry 1.84 1.92 R 1.84 L. -4.21 R -7.58 -1.35 By pass Rinse Cycle R -2.20 -2.08 R -5.36 Evaluate the significance of each factor using t-test. Show formulas and calculation steps of the statistical analysis method.arrow_forwardFind mZG. I 5/3 mZG = Submit % Warrow_forwardcientists studied the chemical makeup of buried tills (glacial drifts) in order to estimate the age of the glacial drifts. The ratio of the elements aluminum (Al) and ryllium (Be) in sediment is related to the duration of burial. The till specimens were obtained from five different boreholes (labeled UMRB-1, UMRB-2, UMRB-3, SWRA nd SD). The Al/Be ratios for a sample of 26 buried till specimens were determined and are shown in the accompanying table. Conduct an analysis of variance of the ata. Is there sufficient evidence to indicate differences among the mean Al/Be ratios for the five boreholes? Test, using α = 0.10. Click the icon to view the table. et up the null and the alternative hypotheses. Choose the correct answer below. OA. Ho: At least two treatment means differ and Ha: ₁ = H₂ = H3 = H4 = H5 B. Ho: H₁ = μ₂ = 3 = H4 = μ5 and H₂: At least two treatment means differ a O C. Ho: M₁arrow_forwardFind the measurements of the following.arrow_forward12.3 MRSA, or Staphylococcus aureus, can cause a serious bacterial infections in hospital patients. Table 12.8 shows various colony counts from different patients who may or may not have MRSA. The data from the table is plotted in Figure 12.5. Conc = 0.6 Conc = 0.8 16 93 82 9 66 98 Table 12.8 Plot of the data for the different concentrations: Tryptone concentrations 1.4 1.2 1- 0.8 0.6 . 50 Conc = 1.0 22 147 120 Conc = 1.2 30 199 148 100 Colony counts 150 Conc = 1.4 27 168 132 200 Figure 12.5 Test whether the mean number of colonies are the same or are different. Construct the ANOVA table, find the p-value, and state your conclusion. Use a 5% significance level.arrow_forwardRadon is a gas emitted from the ground that can collect in houses in buildings. At certain levels it can cause lung cancer. Radon concentrations are measured in picocuries per liter (pCi/L). A radon level of 4 pCi/L is considered “acceptable” Radon levels in a house vary from week to week. In one house, a sample of 6 weeks had the following readings for radon level (in pCi/L): 1.9 2.8 3.9 3.9 4.2 5.7 Find the variance and standard deviation (definitional formula). Show your work using a table.arrow_forwardarrow_back_iosSEE MORE QUESTIONSarrow_forward_ios
 Algebra & Trigonometry with Analytic GeometryAlgebraISBN:9781133382119Author:SwokowskiPublisher:Cengage
 Mathematics For Machine TechnologyAdvanced MathISBN:9781337798310Author:Peterson, John.Publisher:Cengage Learning,
 Algebra: Structure And Method, Book 1AlgebraISBN:9780395977224Author:Richard G. Brown, Mary P. Dolciani, Robert H. Sorgenfrey, William L. ColePublisher:McDougal Littell
 Trigonometry (MindTap Course List)TrigonometryISBN:9781337278461Author:Ron LarsonPublisher:Cengage Learning