
Concept explainers
Videos
The residuals from the least-squares line for the data given in the previous exercise are shown in the accompanying table.
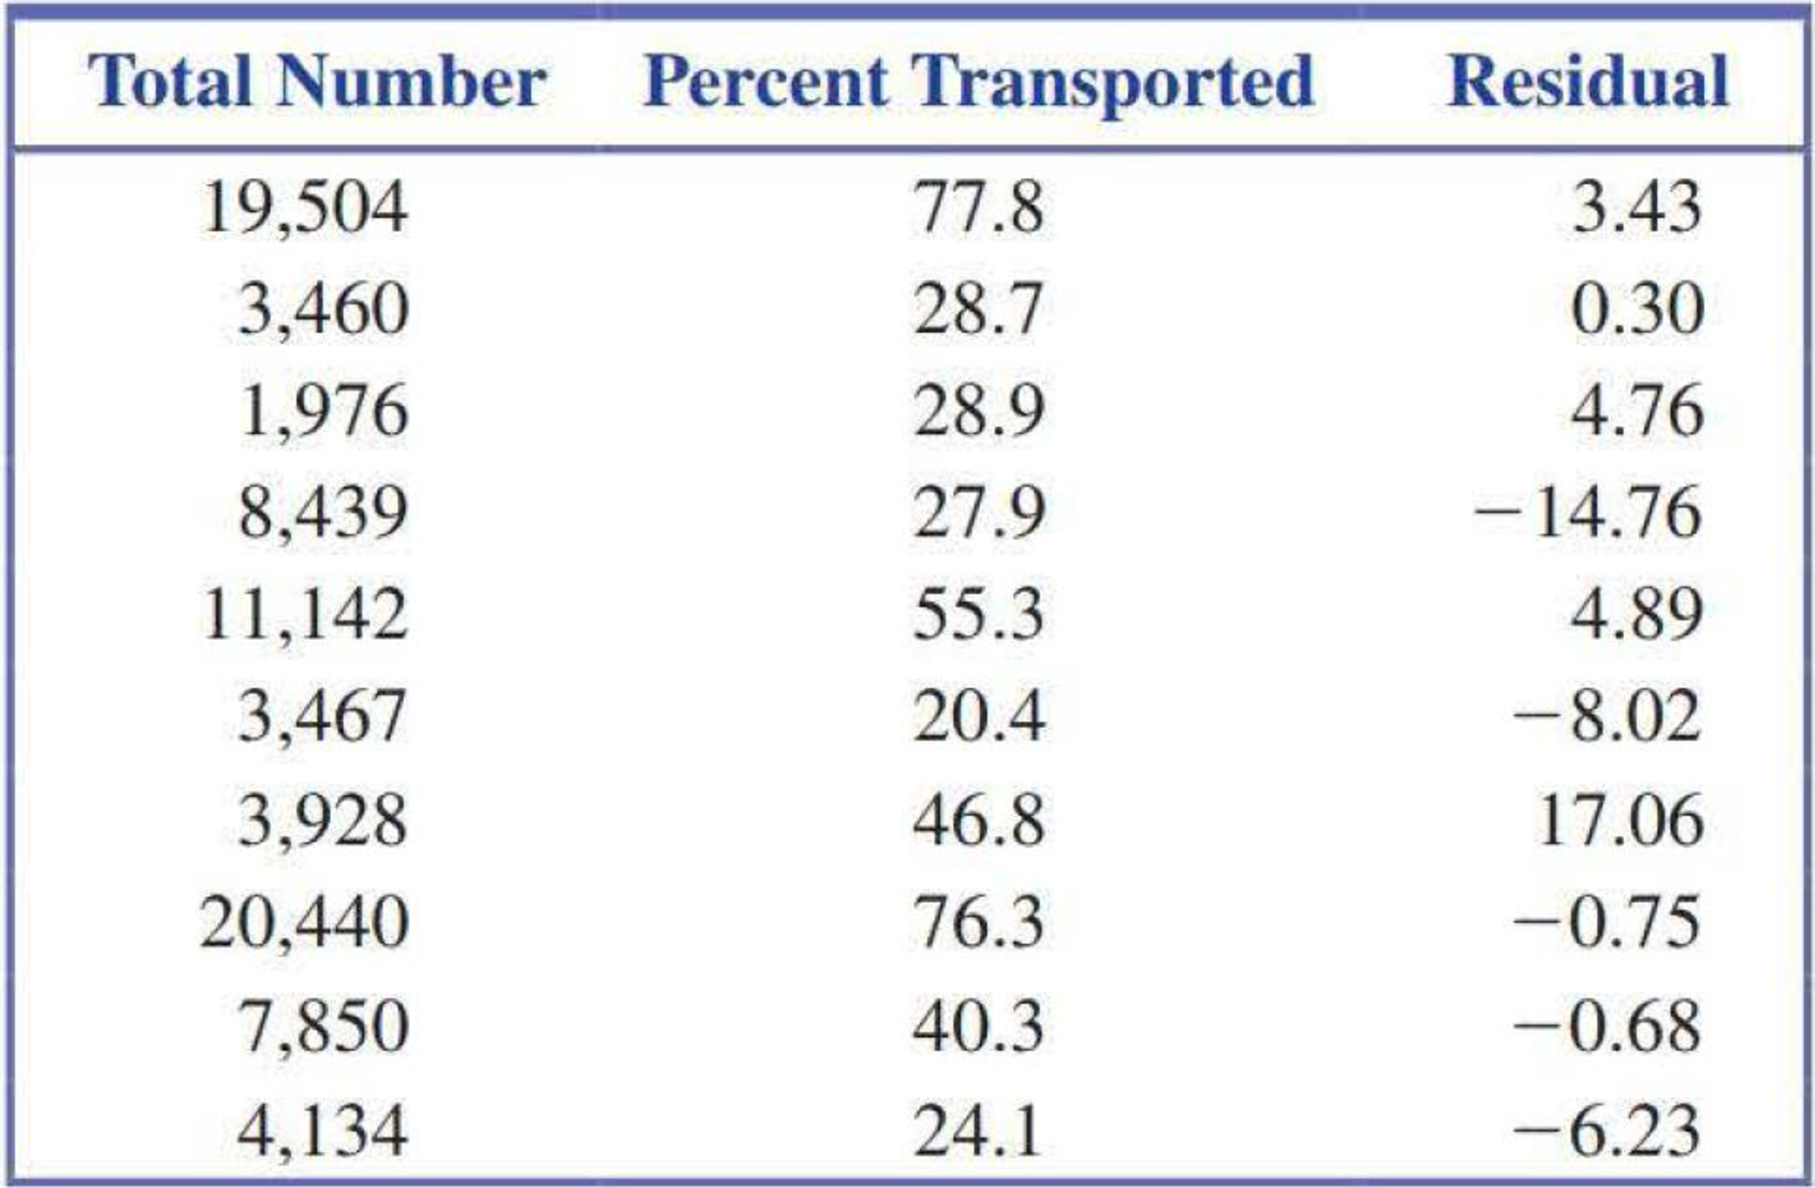
- a. The observation (3928, 46.8) has a large residual. Is this data point also an influential observation?
- b. The two points with unusually large x values (19,504 and 20,440) were not thought to be influential observations even though they are far removed in the x direction from the rest of the points in the
scatterplot . Explain why these two points are not influential. - c. Partial Minitab output resulting from fitting the least-squares line is shown here. What is the value of se? Write a sentence interpreting this value.
The regression equation is
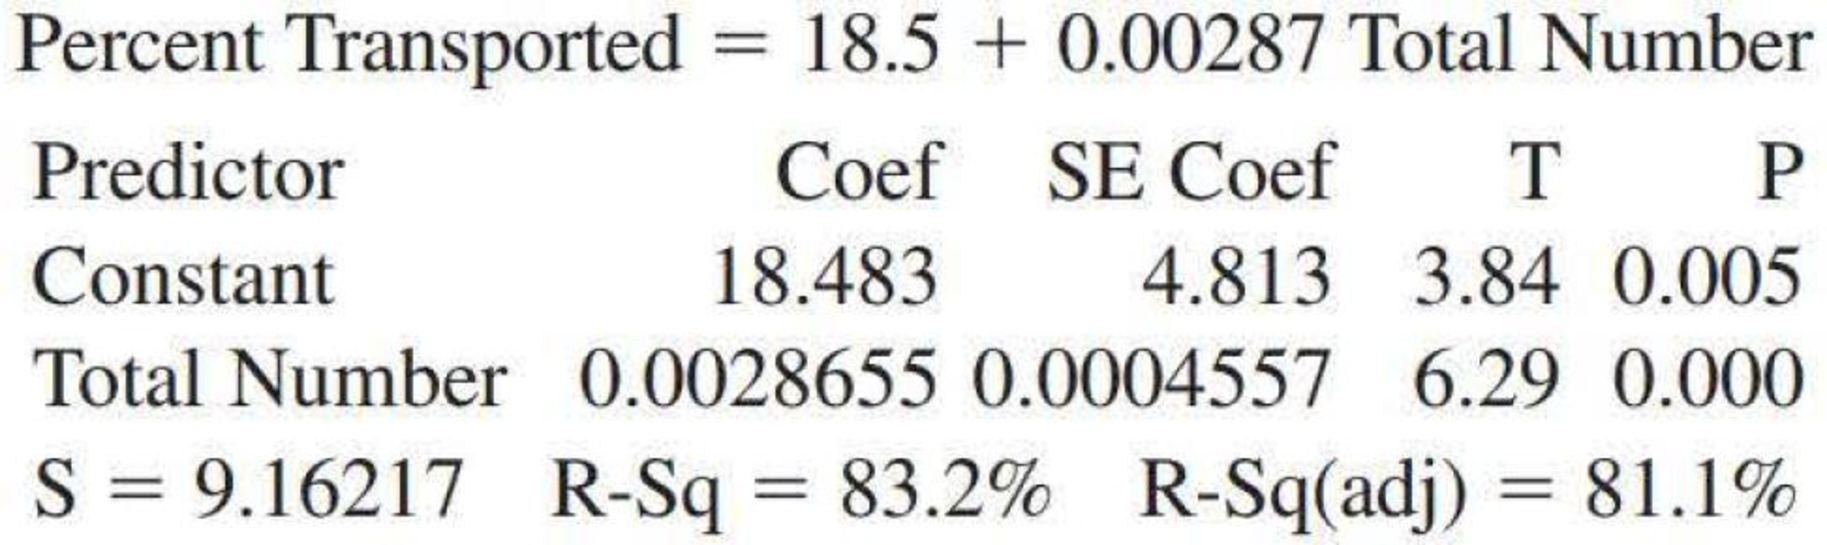
- d. What is the value of r2 for this data set (see Minitab output in Part (c))? Is the value of r2 large or small? Write a sentence interpreting the value of r2.
5.43 ● The relationship between x = Total number of salmon in a creek and y = Percentage of salmon killed by bears that were transported away from the stream prior to the bear eating the salmon was examined in the paper “Transportation of Pacific Salmon Carcasses from Streams to Riparian Forests by Bears” (Canadian Journal of Zoology [2009]: 195–203).
Data for the 10 years from 1999 to 2008 is given in the accompanying table.
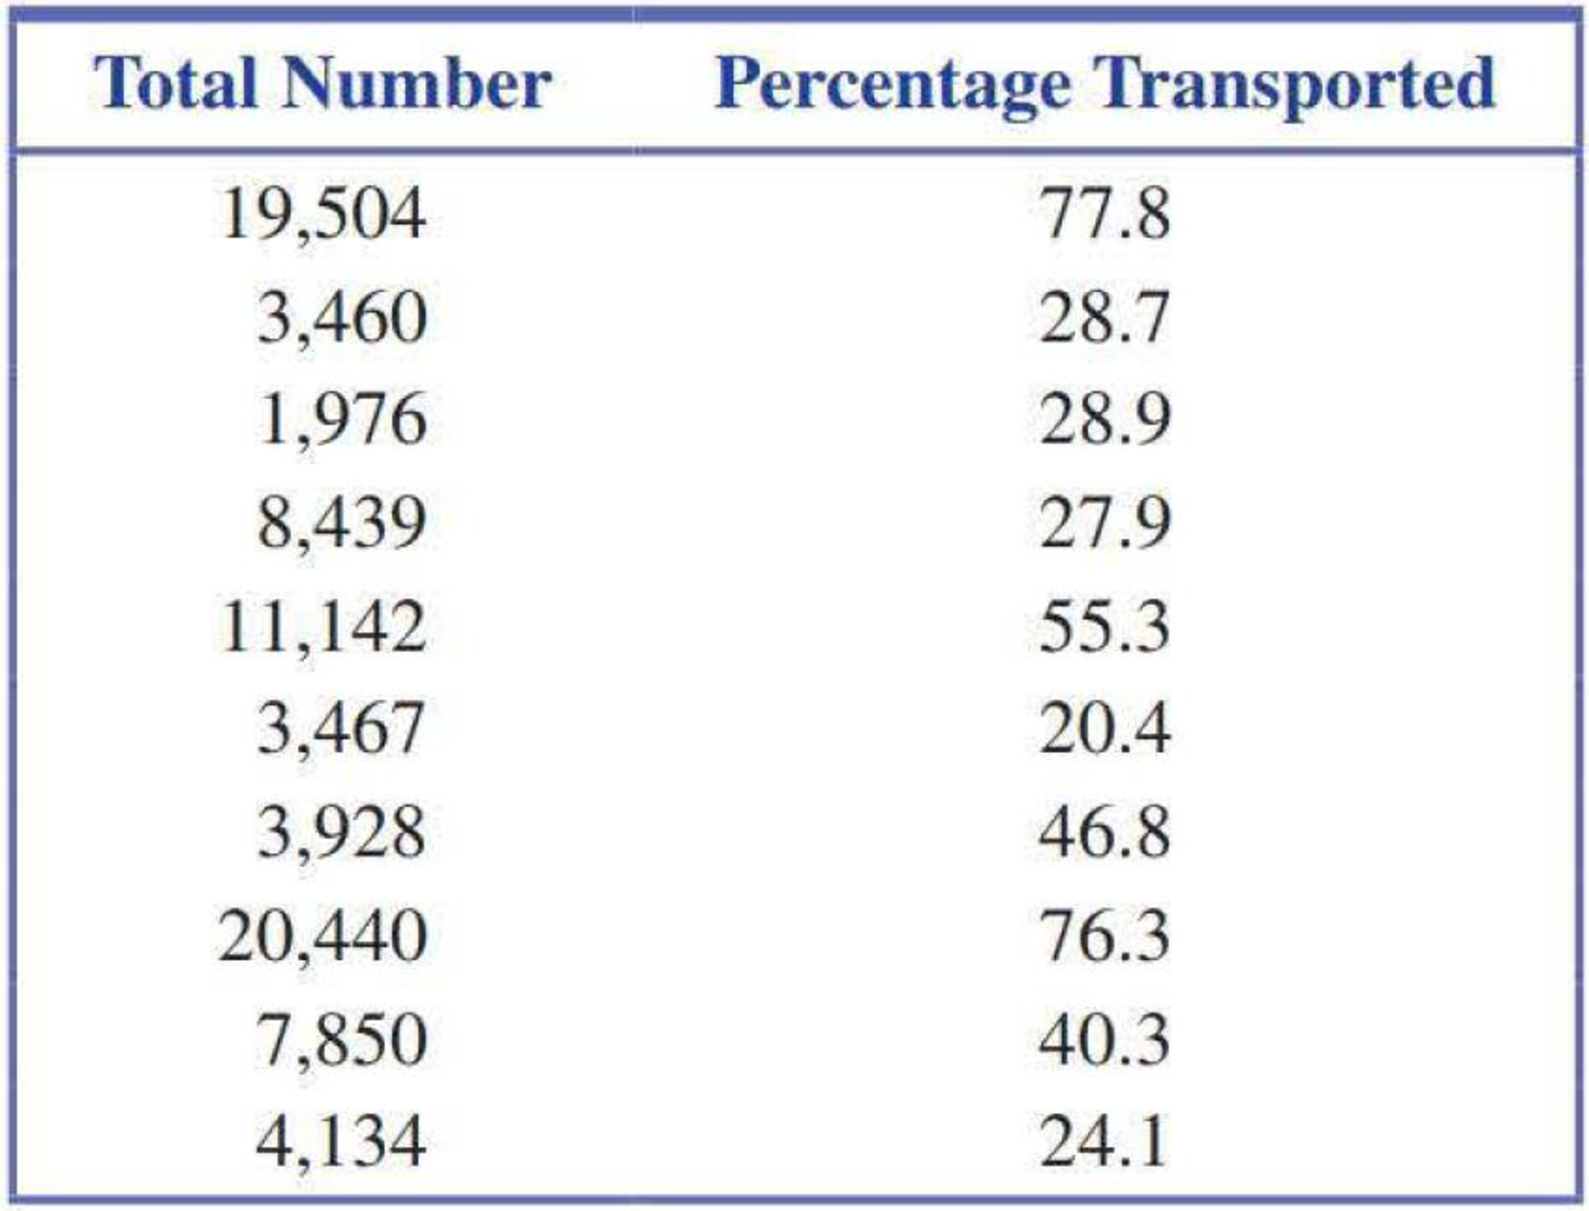
- a. Construct a scatterplot of the data.
- b. Does there appear to be a relationship between the total number of salmon in the stream and the percentage of salmon killed by bears that are transported away from the stream?
- c. Find the equation of the least-squares line. Draw the least-squares line on the scatterplot from Part (a).

Trending nowThis is a popular solution!

Chapter 5 Solutions
Introduction To Statistics And Data Analysis
Additional Math Textbook Solutions
Fundamentals of Statistics (5th Edition)
Essentials of Statistics (6th Edition)
Elementary Statistics Using The Ti-83/84 Plus Calculator, Books A La Carte Edition (5th Edition)
Business Statistics: A First Course (8th Edition)
The Practice of Statistics for AP - 4th Edition
Statistical Reasoning for Everyday Life (5th Edition)


- For the following table of data. x 1 2 3 4 5 6 7 8 9 10 y 0 0.5 1 2 2.5 3 3 4 4.5 5 a. draw a scatterplot. b. calculate the correlation coefficient. c. calculate the least squares line and graph it on the scatterplot. d. predict the y value when x is 11.arrow_forwardFind the equation of the regression line for the following data set. x 1 2 3 y 0 3 4arrow_forward
 Linear Algebra: A Modern IntroductionAlgebraISBN:9781285463247Author:David PoolePublisher:Cengage Learning
 Calculus For The Life SciencesCalculusISBN:9780321964038Author:GREENWELL, Raymond N., RITCHEY, Nathan P., Lial, Margaret L.Publisher:Pearson Addison Wesley,
 Algebra & Trigonometry with Analytic GeometryAlgebraISBN:9781133382119Author:SwokowskiPublisher:Cengage
 Glencoe Algebra 1, Student Edition, 9780079039897...AlgebraISBN:9780079039897Author:CarterPublisher:McGraw Hill
 Functions and Change: A Modeling Approach to Coll...AlgebraISBN:9781337111348Author:Bruce Crauder, Benny Evans, Alan NoellPublisher:Cengage Learning
 Big Ideas Math A Bridge To Success Algebra 1: Stu...AlgebraISBN:9781680331141Author:HOUGHTON MIFFLIN HARCOURTPublisher:Houghton Mifflin Harcourt