
Videos
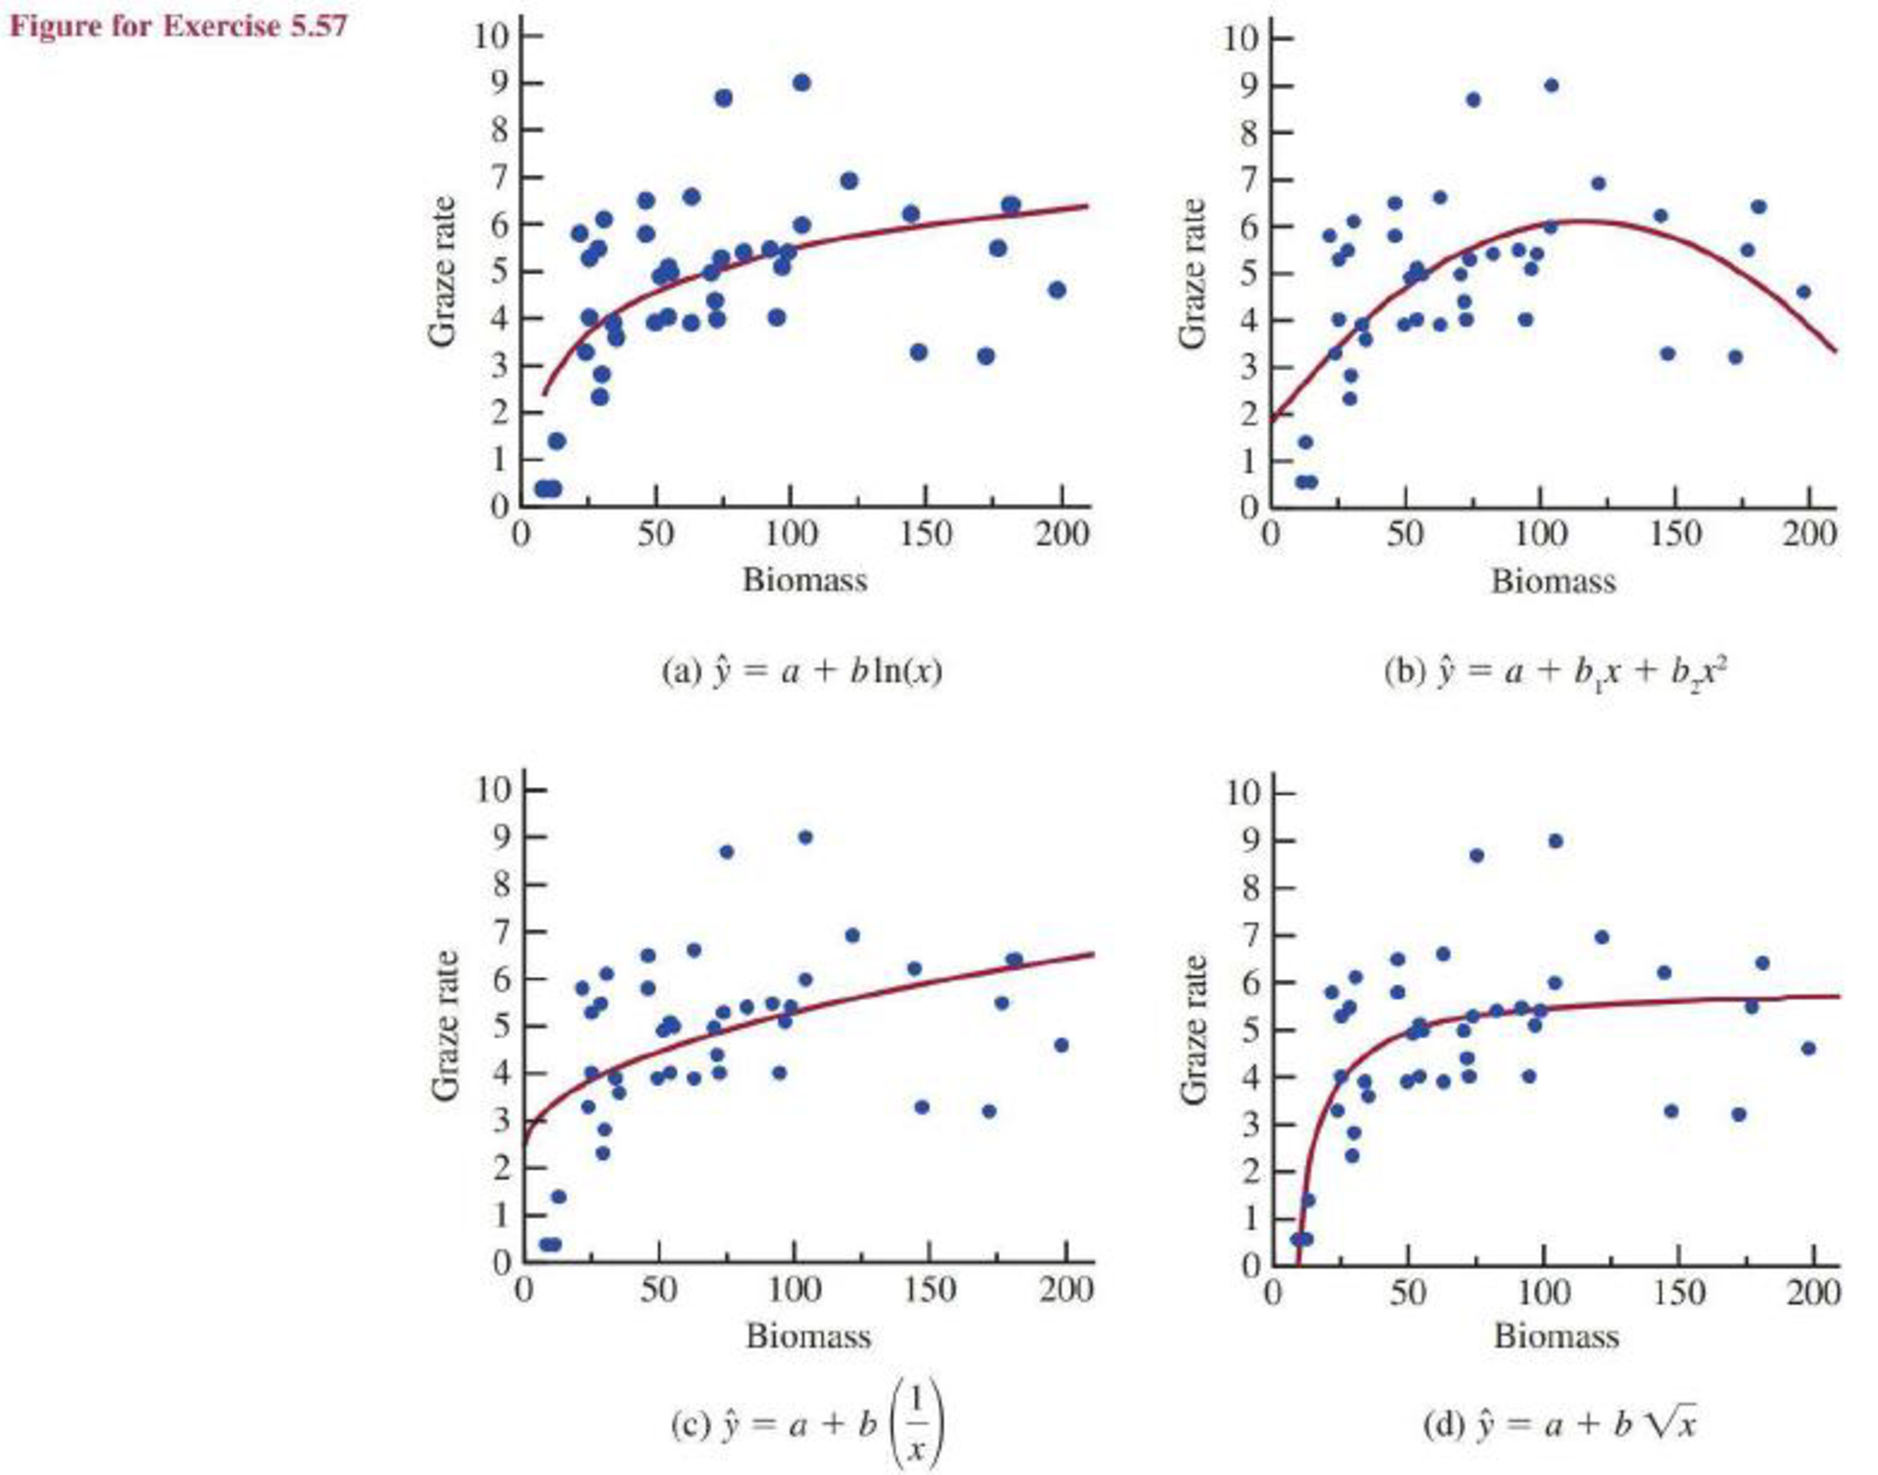
Food intake of grazing animals is limited by the rate grass can be chewed and swallowed, as well as the rate at which food can be digested. The authors of the paper “What Constrains Daily Intake in Thomson’s Gazelles?” (Ecology [1999]: 2338–2347) observed the grazing activity of captive Thomson’s gazelles. They recorded grazing rate (amount of grass eaten, in grams per minute) and biomass of the grazing area (food density, in grams per square meter).
Want to see the full answer?
Check out a sample textbook solution
Chapter 5 Solutions
Introduction To Statistics And Data Analysis


- The Lion’sMane. In a study by P. M.West titled “The Lion’s Mane” (American Scientist, Vol. 93, No. 3, pp. 226–236), the effects of the mane of a male lion as a signal of quality to mates and rivals was explored. Four life-sized dummies of male lions provided a tool for testing female response to the unfamiliar lions whose manes varied by length (long or short) and color (blonde or dark). The female lions were observed to see whether they approached each of the four life-sized dummies. a. experimental units. b. response variable. c. factor(s). d. levels of each factor. e. treatments.arrow_forward6B A study was conducted that measured the total brain volume (TBV) (in mm3) of patients that had schizophrenia and patients that are considered normal. Table #1 contains the TBV of the normal patients and Table #2 contains the TBV of schizophrenia patients ("SOCR data Oct2009," 2013). Table #1: Total Brain Volume (in mm3) of Normal Patients 1663407 1583940 1299470 1535137 1431890 1578698 1453510 1650348 1288971 1366346 1326402 1503005 1474790 1317156 1441045 1463498 1650207 1523045 1441636 1432033 1420416 1480171 1360810 1410213 1574808 1502702 1203344 1319737 1688990 1292641 1512571 1635918 Table #2: Total Brain Volume (in mm3) of Schizophrenia Patients 1331777 1487886 1066075 1297327 1499983 1861991 1368378 1476891 1443775 1337827 1658258 1588132 1690182 1569413 1177002 1387893 1483763 1688950 1563593 1317885 1420249 1363859 1238979…arrow_forwardArchaeologists can determine the diets of ancient civilizations by measuring the ratio of carbon-13 to carbon-12 in bones found at burial sites. Large amounts of carbon-13 suggest a diet rich in grasses such as maize, while small amounts suggest a diet based on herbaceous plants. The article "Climate and Diet in Fremont Prehistory: Economic Variability and Abandonment of Maize Agriculture in the Great Salt Lake Basin" (J. Coltrain and S. Leavitt, American Antiquity, 2002:453-485) reports ratios, as a difference from a standard in units of parts per thousand, for bones from individuals in several age groups. The data are presented in the following table. Ratio Age Group (years) 0-11 17.2 18.4 17.9 16.6 19.0 18.3 13.6 13.5 18.5 19.1 19.1 13.4 12-24 14.8 17.6 18.3 17.2 10.0 11.3 10.2 17.0 18.9 19.2 25-45 18.4 13.0 14.8 18.4 12.8 17.6 18.8 179 18.5 17.5 18.3 15.2 10.8 19.8 1 19.2 15.4 13.2 46+ 15.5 18.2 12.7 15.1 18.2 18.0 14.4 10.2 16.7 Construct an ANOVA table. You may give a range for…arrow_forward
- Health care workers who use latex gloves with glove powder on a daily basis are particularly susceptible to developing a latex allergy. Each in a sample of 47 hospital employees who were diagnosed with a latex allergy based on a skin-prick test reported on their exposure to latex gloves. Summary statistics for the number of latex gloves used per week are x = 19.7 and s = 12.1. Complete parts (a)-(d). a. Give a point estimate for the average number of latex gloves used per week by all health care workers with a latex allergy. 19.7 b. Form a 95% confidence interval for the average number of latex gloves used per week by all health care workers with a latex allergy. (16.24, 23.16) (Use integers or decimals for any numbers in the expression. Round to two decimal places as needed.) c. Give a practical interpretation of the interval, part (b). OA. One can be 95% confident that the average number of latex gloves used per week by all healthcare workers with latex allergy is greater than the…arrow_forwardHealth care workers who use latex gloves with glove powder on a daily basis are particularly susceptible to developing a latex allergy. Each in a sample of 45 hospital employees who were diagnosed with a latex allergy based on a skin-prick test reported on their exposure to latex gloves. Summary statistics for the number of latex gloves used per week are x = 19.5 and s = 12.1. Complete parts (a) - (d). a. Give a point estimate for the average number of latex gloves used per week by all health care workers with a latex allergy. 19.5 b. Form a 95% confidence interval for the average number of latex gloves used per week by all health care workers with a latex allergy. (Use integers or decimals for any numbers in the expression. Round to two decimal places as needed.)arrow_forwardAs the world warms, the geographic ranges of species might shift toward cooler areas. Chen et al. (2011) studied recent changes in the highest elevation at which species occur. Typically, higher elevations are cooler than lower elevations. Below are the changes in highest elevation for 20 of the 31 taxa examined in this study, in meters, over the late 1900s and early 2000s. (Taxa included plants, vertebrates, and arthropods.) Positive numbers indicate upward shifts in elevation, and negative numbers indicate shifts to lower elevations. The values are also displayed in the attached graph. What is the standard error of the mean of elevational range shift in these 20 species? (Do not include units, but remember they are meters), and express answer to 3 significant digits) 58.9 7.8 108.6 44.8 19.2 30.5 7.4 39.3 24 62.1 24.3 32.7 65.3 -19.3 -5.2 -2.1 31 88.6 20.7 89 9 8 7 6 5 4 3 2 1 0 Elevation change in m [-19.3, 0.7] (0.7, 20.7] (20.7, 40.7] (40.7, 60.7] (60.7, 80.7] (80.7, 100.7 100.7,…arrow_forward
- Environmental conditions can affect the growth of coral. To study this, a researcher examined a species of coral that is found in the Caribbean Sea and the Gulf of Mexico. At 12 localities, he determined the average annual calcification rate of coral over a period of several years and the average annual maximum sea surface temperature during the same period. Calcification rate affects the growth of coral, with higher rates corresponding to greater growth. The table contains data for these 12 localities. Maximum sea surface temperature (°C) and calcification rate (g cm² yr¯¹) Maximum Sea Surface Temperature 29.4 29.4 29.4 29.6 29.1 28.7 Calcification Rate 1.48 1.53 1.52 1.48 1.31 1.25 Maximum Sea Surface Temperature 29.7 29.5 29.4 29.0 29.0 29.0 Calcification Rate 1.63 1.53 1.46 1.24 1.29 1.12 To access the complete data set, click the link for your preferred software format: Excel Minitab JMP SPSS TI R Mac-TXT PC-TXT CSV CrunchIt! The residuals for average annual maximum sea surface…arrow_forwardHealth care workers who use latex gloves with glove powder on a daily basis are particularly susceptible to developing a latex allergy. Each in a sample of 47 hospital employees who were diagnosed with a latex allergy based on a skin-prick test reported on their exposure to latex gloves. Summary statistics for the number of latex gloves used per week are x = 19.3 and s = 12.3. Complete parts (a) - (d). a. Give a point estimate for the average number of latex gloves used per week by all health care workers with a latex allergy. b. Form a 95% confidence interval for the average number of latex gloves used per week by all health care workers with a latex allergy. (Use integers or decimals for any numbers in the expression. Round to two decimal places as needed.) с. Gi a practical interpretation of the interval, part (b). A. One can be 95% confident that latex gloves cause allergies for all who use a number of gloves contained in the interval. B. One can be 95% confident that the average…arrow_forwardCell Phone Radiation Listed below are the measured radiation absorption rates (in W/kg) corresponding to these cell phones: iPhone 5S, BlackBerry Z30, Sanyo Vero, Optimus V, Droid Razr, Nokia N97, Samsung Vibrant, Sony Z750a, Kyocera Kona, LG G2, and Virgin Mobile Supreme. The data are from the Federal Communications Commission. If one of each model of cell phone is measured for radiation and the results are used to find the measures of variation, are the results typical of the population of cell phones that are in use?arrow_forward
- A medical student at a community college in city Q wants to study the factors affecting the systolic blood pressure of a person (Y). Generally, the systolic blood pressure depends on the BMI of a person (B) and the age of the person A. She wants to test whether or not the BMI has a significant effect on the systolic blood pressure, keeping the age of the person constant. For her study, she collects a random sample of 150 patients from the city and estimates the following regression function: Y= 15.50 +0.90B + 1.10A. (0.48) (0.35) The test statistic of the study the student wants to conduct (Ho: B, =0 vs. H4: B, #0), keeping other variables constant is. (Round your answer to two decimal places.) At the 5% significance level, the student will v the null hypothesis. Keeping BMI constant, she now wants test whether the age of a person (A) has no significant effect or a positive effect on the person's systolic blood pressure. So, the test statistic associated with the one-sided test the…arrow_forwardFifteen adult males between the ages of 35 and 50 participated in a study to evaluate the effect of diet and exercise on blood cholesterol levels. The total cholesterol was measured in each subject initially and then three months after participating in an aerobic exercise program and switching to a low-fat diet. The data are shown in the following table.arrow_forward
 Linear Algebra: A Modern IntroductionAlgebraISBN:9781285463247Author:David PoolePublisher:Cengage Learning
 Glencoe Algebra 1, Student Edition, 9780079039897...AlgebraISBN:9780079039897Author:CarterPublisher:McGraw Hill