
Videos
The authors of the paper “Evaluating Existing Movement Hypotheses in Linear Systems Using Larval Stream Salamanders” (Canadian Journal of Zoology [2009]: 292–298) investigated whether water temperature was related to how far a salamander would swim and whether it would swim upstream or downstream. Data for 14 streams with different
The two variables of interest are x = Mean water temperature (°C) and y = Net directionality, which was defined as the difference in the relative frequency of the released salamander larvae moving upstream and the relative frequency of released salamander larvae moving downstream. A positive value of net directionality means a higher proportion were moving upstream than downstream. A negative value of net directionality means a higher proportion were moving downstream than upstream.
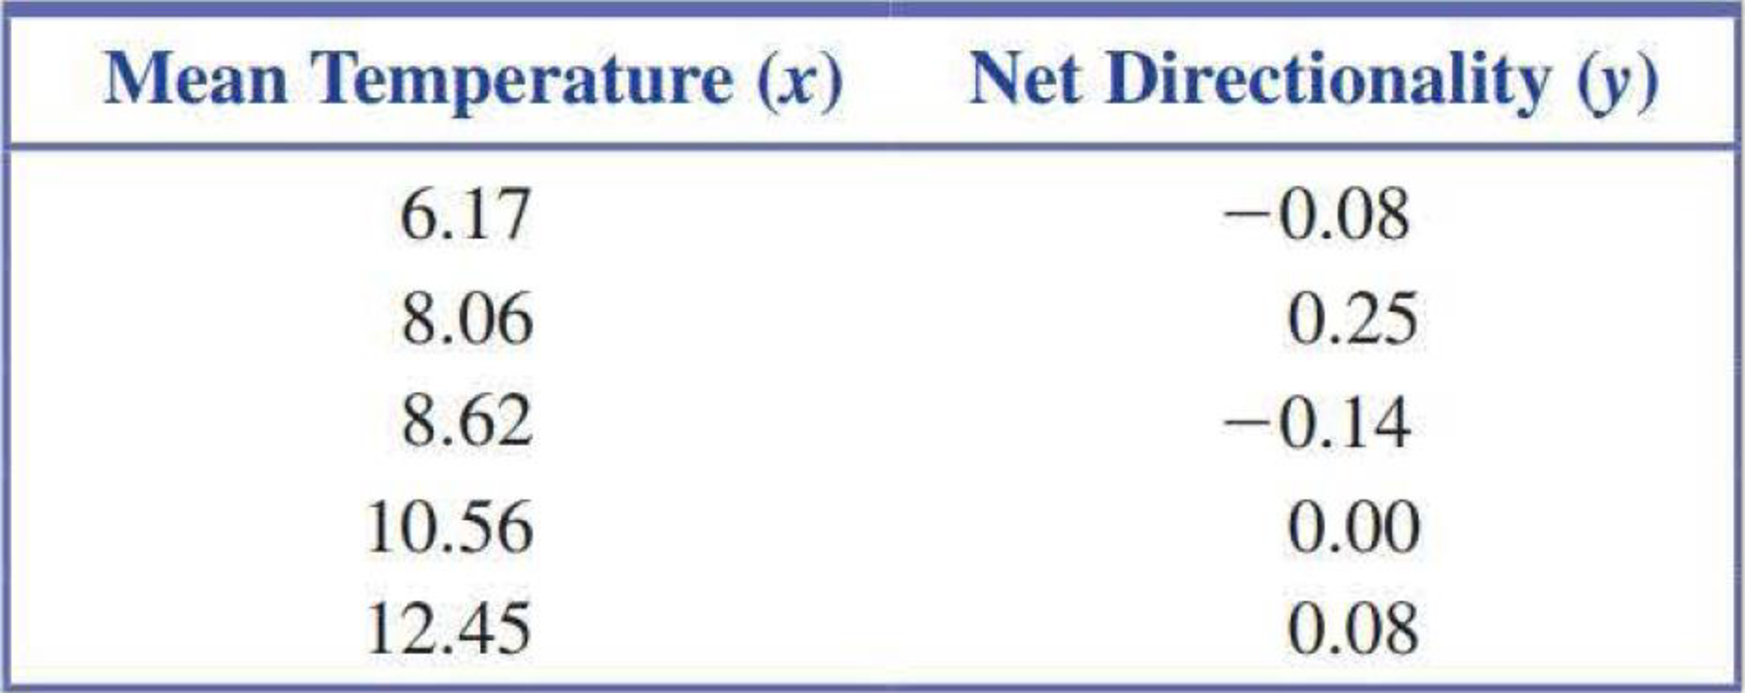
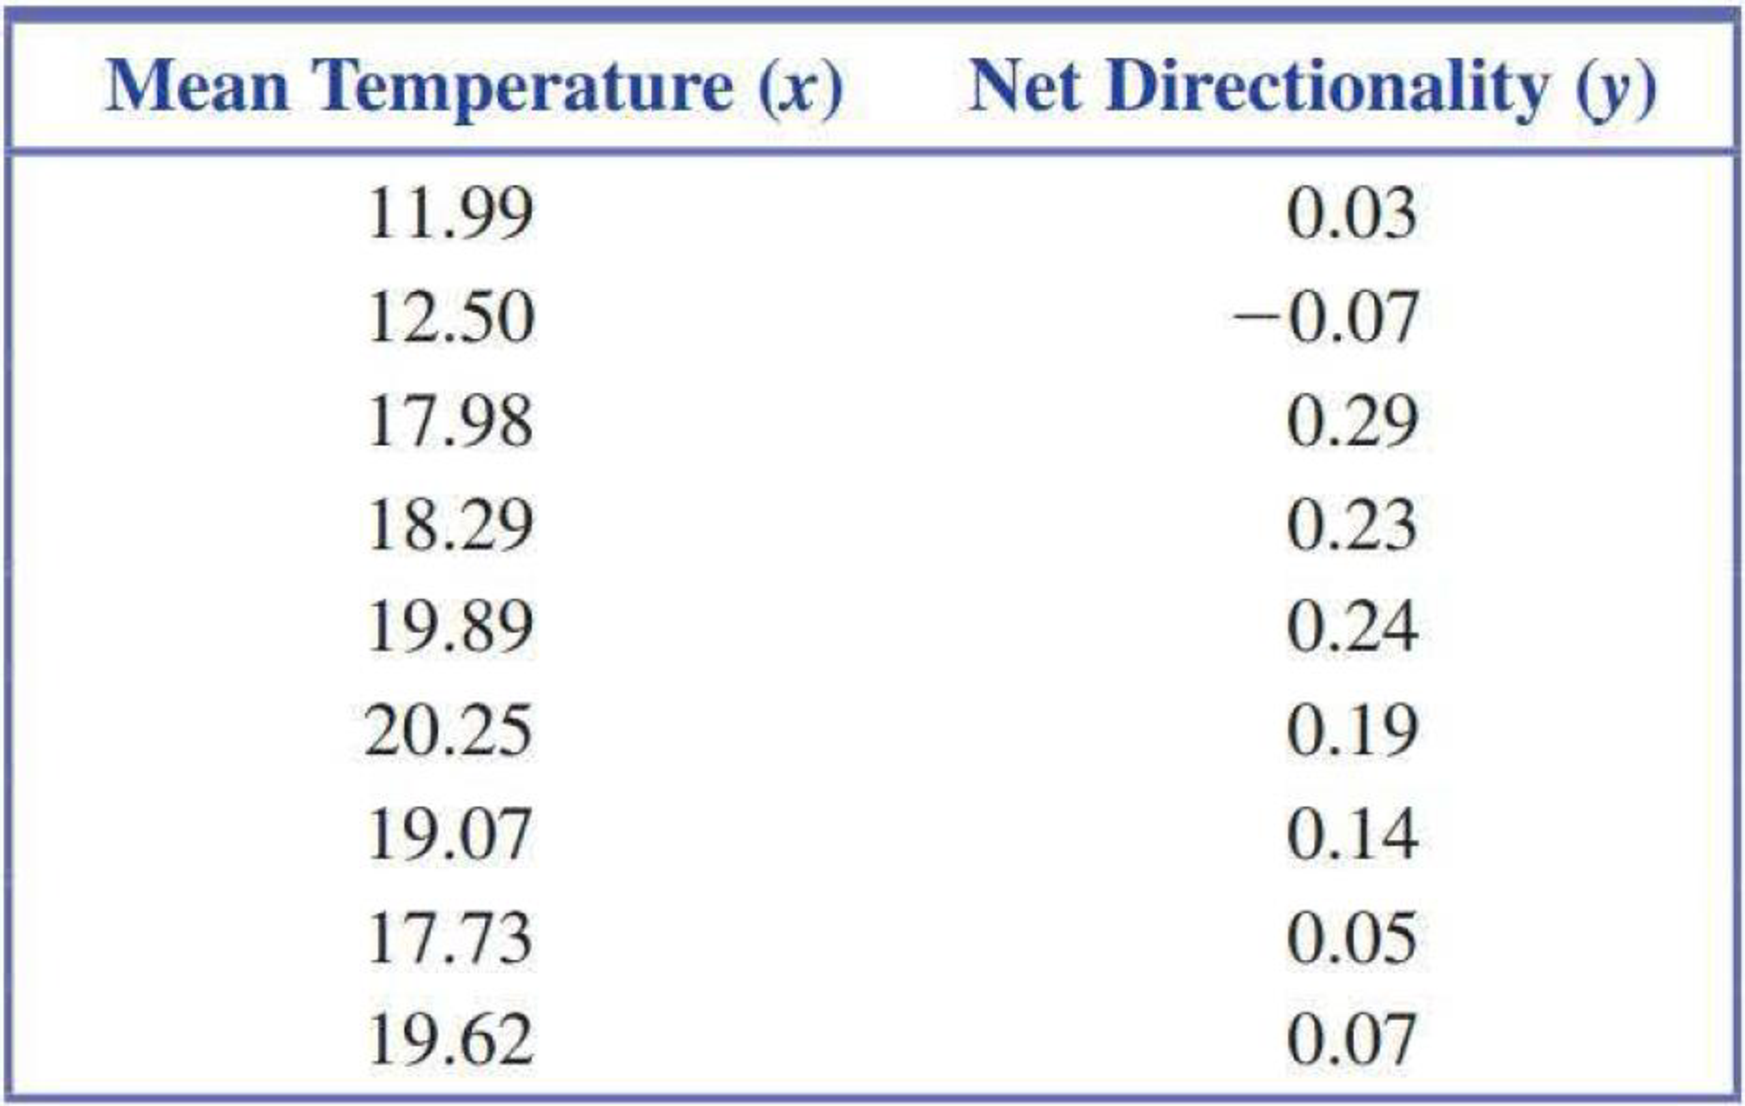
- a. Construct a
scatterplot of the data. How would you describe the relationship between x and y? - b. Find the equation of the least-squares line describing the relationship between y = Net directionality and x = Mean water temperature.
- c. What value of net directionality would you predict for a stream that had mean water temperature of 15 °C?

Trending nowThis is a popular solution!

Chapter 5 Solutions
Introduction To Statistics And Data Analysis
Additional Math Textbook Solutions
Elementary Statistics
Intro Stats, Books a la Carte Edition (5th Edition)
Elementary Statistics (Text Only)
Statistics for Business and Economics (13th Edition)
The Practice of Statistics for AP - 4th Edition
Applied Statistics in Business and Economics


- Among the literature on quitting smoking are data detailing the relative successfulness of people of different ages in quitting smoking. A study of 400 adults who began various smoking-cessation programs produced the data in the table below. In the table, each participant is classified according to two variables: length of their smoking cessation period ("Less than two weeks", "Between two weeks and one year", or "At least one year") and age ("21-34", or "35 and over"). In the table, "less than two weeks" means that the individual returned to smoking within two weeks of beginning the program; "between two weeks and one year" means that the individual lasted the first two weeks without smoking but retuned to smoking within a year; and "at least one year" means that the individual has not smoked for at least a year since beginning the program. The table is a contingency table whose cells contain the respective observed frequencies of classifications of the 400 smokers. In addition, three…arrow_forwardThe regional transit authority for a major metropolitan area wants to determine whether there is any relationship between the age of a bus and the annual maintenance cost. A sample of 10 buses resulted in the data in Worksheet 2. Worksheet 2 Age of a Bus (years) Maintenance Cost ($) 1 350 2 370 2 480 2 520 2 590 3 550 4 750 4 800 5 790 5 950 Develop a scatter diagram with the age of a bus as the independent variable. Develop the estimated regression equation that can be used to predict the maintenance cost given the age of a bus. Determine the coefficient of determination, and interpret its meaning in this problem. At the 0.05 level of significance, is there evidence of a linear relationship between the age of a bus and the annual maintenance cost.arrow_forwardThe authors of a paper compared two different methods for measuring body fat percentage. One method uses ultrasound, and the other method uses X-ray technology. Body fat percentages using each of these methods for 16 athletes (a subset of the data given in a graph that appeared in the paper) are given in the accompanying table. You can assume that the 16 athletes who participated in this study are representative of the population of athletes. Athlete X-ray Ultrasound 1 5.00 4.25 2 12.00 8.75 3 9.25 9.00 4 12.00 11.75 5 17.25 17.00 6 29.50 27.50 7 5.50 6.50 8 6.00 6.75 9 8.00 8.75 10 9.50 10.50 11 9.25 9.50 12 11.00 12.00 13 12.00 12.25 14 14.00 15.50 15 17.00 18.00 16 18.00 18.25 Use these data to estimate the difference in mean body fat percentage measurement for the two methods. Use a confidence level of 95%. (Use ?d = ?X-ray − ?ultrasound. Round your answers to three decimal places.) , % Interpret the interval in…arrow_forward
- The authors of a paper compared two different methods for measuring body fat percentage. One method uses ultrasound, and the other method uses X-ray technology. Body fat percentages using each of these methods for 16 athletes (a subset of the data given in a graph that appeared in the paper) are given in the accompanying table. You can assume that the 16 athletes who participated in this study are representative of the population of athletes. Athlete X-ray Ultrasound 1 5.00 4.25 2 15.00 11.75 3 9.25 9.00 4 12.00 11.75 5 17.25 17.00 6 29.50 27.50 7 5.50 6.50 8 6.00 6.75 9 8.00 8.75 10 15.50 16.50 11 9.25 9.50 12 11.00 12.00 13 12.00 12.25 14 14.00 15.50 15 17.00 18.00 16 18.00 18.25 Use these data to estimate the difference in mean body fat percentage measurement for the two methods.arrow_forwardThe authors of a paper compared two different methods for measuring body fat percentage. One method uses ultrasound, and the other method uses X-ray technology. Body fat percentages using each of these methods for 16 athletes (a subset of the data given in a graph that appeared in the paper) are given in the accompanying table. You can assume that the 16 athletes who participated in this study are representative of the population of athletes. Athlete X-ray Ultrasound 1 5.00 4.25 2 16.00 12.75 3 9.25 9.00 4 12.00 11.75 5 17.25 17.00 6 29.50 27.50 7 5.50 6.50 8 6.00 6.75 9 8.00 8.75 10 9.50 10.50 11 9.25 9.50 12 11.00 12.00 13 12.00 12.25 14 14.00 15.50 15 17.00 18.00 16 18.00 18.25 Use these data to estimate the difference in mean body fat percentage measurement for the two methods. Use a confidence level of 95%. (Use ?d = ?X-ray − ?ultrasound. Round your answers to three decimal places.) , % Interpret the interval in context.…arrow_forwardThe authors of a paper compared two different methods for measuring body fat percentage. One method uses ultrasound, and the other method uses X-ray technology. Body fat percentages using each of these methods for 16 athletes (a subset of the data given in a graph that appeared in the paper) are given in the accompanying table. You can assume that the 16 athletes who participated in this study are representative of the population of athletes. Athlete X-ray Ultrasound 1 5.00 4.50 2 15.00 11.75 3 9.25 9.00 4 12.00 11.75 5 17.25 17.00 6 29.50 27.50 7 5.50 6.50 8 6.00 6.75 9 8.00 8.75 10 16.50 17.50 11 9.25 9.50 12 11.00 12.00 13 12.00 12.25 14 14.00 15.50 15 17.00 18.00 16 18.00 18.25 Use these data to estimate the difference in mean body fat percentage measurement for the two methods. Use a confidence level of 95%. (Use ?d = ?X-ray − ?ultrasound. Round your answers to three decimal places.) , % Interpret the interval in…arrow_forward
- Suppose that as part of a research methods class, Bailey was asked to write summaries of research papers on the following topics. • The effects of increasing temperatures on the migration patterns of birds • The effects of media coverage on community support for crime prevention For each topic, identify the explanatory and the response variables. Temperature and the level of community support for crime prevention are the explanatory variables, and the amount of media coverage and the migration patterns of birds are the response variables. Temperature and the amount of media coverage are the response variables, and the migration patterns of birds and the level of community support for crime prevention are the explanatory variables. Temperature and the amount of media coverage are the explanatory variables, and the migration patterns of birds and the level of community support for crime prevention are the response variables. Temperature and the migration patterns of birds are the…arrow_forwardIs there a relationship between total team salary and the performance of football teams? For a recent season, a linear model predicting Wins (out of 16 regular season games) from the total team Salary (SM) for 32 teams in a football league is Wins = -6.353 +0.105 Salary. Complete parts a through h below. a) What is the explanatory variable? The explanatory variable is because b) What is the response variable? The response variable is because c) What does the slope mean in this context? in this league, team (Type an integer or a decimal. Do not round.) are, on average, about higher for every d) What does the y-intercept mean in this context? Is it meaningful? V is This v meaningful because it The y-intercept is the average of a team in this league whose is (Type an integer or a decimal. Do not round.) e) If one team spends $10 million more than another on salary, how many more games on average would the first team be predicted to win? O game(s) (Type an integer or a decimal. Do not…arrow_forwardThe St. Lucian Government is interested in predicting the number of weekly riders on the public buses using the following variables: • Price of bus trips ~er week • The population in the city • The monthly income of riders • Average rate to park your personal vehicle Number of weekly riders 192,000 Population of city 1,800,000 1,790,000 Price per week Monthly income of riders Average parking rates per month City $15 $5,800 $50 $6,200 $50 190,400 191,200 $15 $15 1,780,000 $6,400 $60 4 $25 $6,500 $60 177,600 176,800 1,778,000 1,750,000 1,740,000 5 $25 $6,550 $60 6. 178,400 $25 $6,580 $70 7 180,800 $25 1,725,000 $8,200 $75 175,200 174,400 $30 $30 1,725,000 $8,600 $8,800 8 $75 9. 1,720,000 $75 10 173,920 $30 1,705,000 $80 $9,200 $9,630 $10,570 $11,330 $11,600 S11,800 $11,830 $12,650 S13.000 1,710,000 1,700,000 11 172,800 163,200 $30 $80 12 $40 $80 13 161,600 $40 1,695,000 1,695,000 1,690,000 $85 14 161,600 160,800 $40 $100 15 $40 $105 1,630,000 1,640,000 1,635,000 16 159,200 $40 $105 17…arrow_forward
- Foot ulcers are a common problem for people with diabetes. Higher skin temperatures on the foot indicate an increased risk of ulcers. The article "An Intelligent Insole for Diabetic Patients with the Loss of Protective Sensation" (Kimberly Anderson, M.S. Thesis, Colorado School of Mines), reports measurements of temperatures, in °F, of both feet for 181 diabetic patients. The results are presented in the following table. Left Foot Right Foot 80 80 85 85 75 80 88 86 89 87 87 82 78 78 88 89 89 90 76 81 89 86 87 82 78 78 80 81 87 82 86 85 76 80 88 89 Construct a scatterplot of the right foot temperature (y) versus the left foot temperature (x). Verify that a linear model is appropriate. b. Compute the least-squares line for predicting the right foot temperature from the left foot temperature. If the left foot temperatures of two patients differ by 2 degrees, by how much would you predict their right foot temperatures to differ? Predict the right foot temperature for a patient whose left…arrow_forward2. Does the herb Echinacea help the common cold? A study investigated the impact of echinacea vs. a standard cold medication on cold symptoms. Each subject in the study chose to take either the echinacea or a standard cold medication in capsule fom After taking the capsule for one week, the subjects then reported to the researchers the status of their cold symptoms. The researchers subsequently reported that there was no statistically significant difference in the duration of the cold between these groups. Identify the type of study. a) Cluster sample b) Social acceptability bias c) Experiment d) Observational studyarrow_forward
 Linear Algebra: A Modern IntroductionAlgebraISBN:9781285463247Author:David PoolePublisher:Cengage Learning
 Calculus For The Life SciencesCalculusISBN:9780321964038Author:GREENWELL, Raymond N., RITCHEY, Nathan P., Lial, Margaret L.Publisher:Pearson Addison Wesley,
 Big Ideas Math A Bridge To Success Algebra 1: Stu...AlgebraISBN:9781680331141Author:HOUGHTON MIFFLIN HARCOURTPublisher:Houghton Mifflin Harcourt
 Glencoe Algebra 1, Student Edition, 9780079039897...AlgebraISBN:9780079039897Author:CarterPublisher:McGraw Hill