
MATLAB: An Introduction with Applications
6th Edition
ISBN: 9781119256830
Author: Amos Gilat
Publisher: John Wiley & Sons Inc
expand_more
expand_more
format_list_bulleted
Related questions
Question
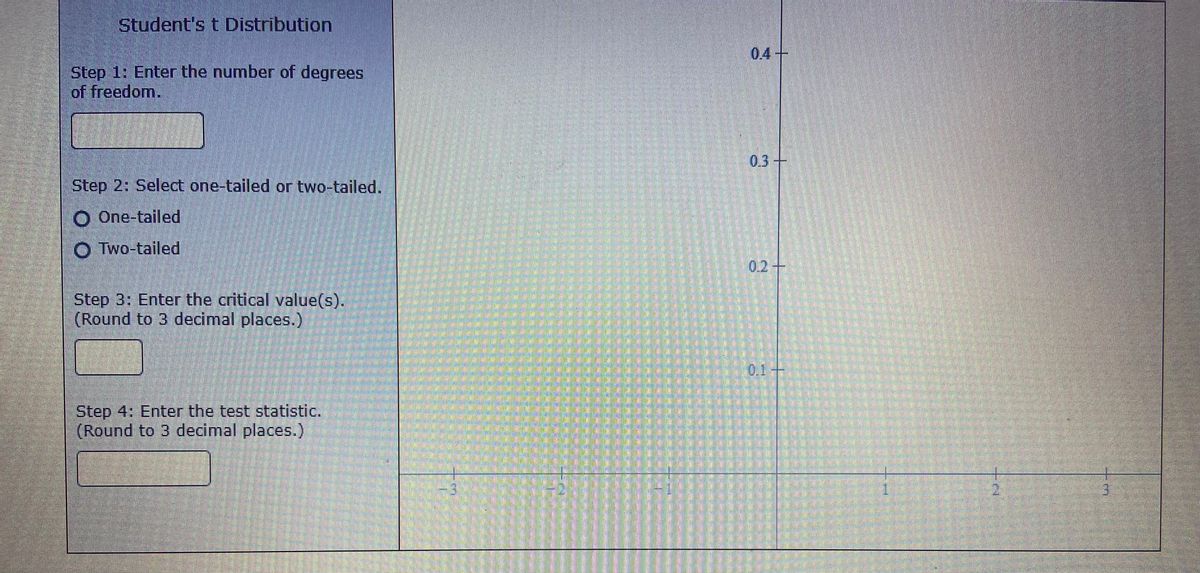

Transcribed Image Text:Student's t Distribution
0.4
Step 1: Enter the number of degrees
of freedom.
0.3+
Step 2: Select one-tailed or two-tailed.
O One-tailed
O Two-tailed
0.2+
Step 3: Enter the critical value(s).
(Round to 3 decimal places.)
0.1+
Step 4: Enter the test statistic.
(Round to 3 decimal places.)
3.
![Tardigrades, or water bears, are a type of micro-animal famous for their resilience. In examining the effects of radiation on organisms, an expert claimed that
the amount of gamma radiation needed to sterilize a colony of tardigrades no longer has a mean of 1150 Gy (grays). (For comparison, humans cannot
withstand more than 10 Gy.) A random sample of 25 tardigrade colonies found that the amount of gamma radiation needed to sterilize a colony had a sample
mean of 1133 Gy, with a sample standard deviation of 62 Gy. Assume that the population of amounts of gamma radiation needed to sterilize a colony of
tardigrades is approximately normally distributed.
Complete the parts below to perform a hypothesis test to see if there is enough evidence, at the 0.05 level of significance, to support that u, the mean amount
of gamma radiation needed to sterilize a colony of tardigrades, is not equal to 1150 Gy.
(a) State the null hypothesis H, and the alternative hypothesis H, that you would use for the test.
H: 1
H: ]
O=D0
ローロ
(b) Perform a hypothesis test. The test statistic has a t distribution (so the test is a "t test"). Here is some other information to help you with your test.
In o25 is the value that cuts off an area of 0.025 in the right tail.
Tho -
of the t
-in ai,On bu ±](https://content.bartleby.com/qna-images/question/af648817-a410-42c0-9aed-d7ed1ec84584/00540e18-5a57-42f3-a5df-0df277fd1081/uaw8np_processed.jpeg)
Transcribed Image Text:Tardigrades, or water bears, are a type of micro-animal famous for their resilience. In examining the effects of radiation on organisms, an expert claimed that
the amount of gamma radiation needed to sterilize a colony of tardigrades no longer has a mean of 1150 Gy (grays). (For comparison, humans cannot
withstand more than 10 Gy.) A random sample of 25 tardigrade colonies found that the amount of gamma radiation needed to sterilize a colony had a sample
mean of 1133 Gy, with a sample standard deviation of 62 Gy. Assume that the population of amounts of gamma radiation needed to sterilize a colony of
tardigrades is approximately normally distributed.
Complete the parts below to perform a hypothesis test to see if there is enough evidence, at the 0.05 level of significance, to support that u, the mean amount
of gamma radiation needed to sterilize a colony of tardigrades, is not equal to 1150 Gy.
(a) State the null hypothesis H, and the alternative hypothesis H, that you would use for the test.
H: 1
H: ]
O=D0
ローロ
(b) Perform a hypothesis test. The test statistic has a t distribution (so the test is a "t test"). Here is some other information to help you with your test.
In o25 is the value that cuts off an area of 0.025 in the right tail.
Tho -
of the t
-in ai,On bu ±
Expert Solution
This question has been solved!
Explore an expertly crafted, step-by-step solution for a thorough understanding of key concepts.

Step by stepSolved in 3 steps

Knowledge Booster

Similar questions
- please answer the following question thank youarrow_forwardQ4A The British Department of Transportation studied to see if people avoid driving on Friday the 13th. They did a traffic count on a Friday and then again on a Friday the 13th at the same two locations ("Friday the 13th," 2013). The data for each location on the two different dates is in following table: Table: Traffic Count Dates 6th 13th 1990, July 139246 138548 1990, July 134012 132908 1991, September 137055 136018 1991, September 133732 131843 1991, December 123552 121641 1991, December 121139 118723 1992, March 128293 125532 1992, March 124631 120249 1992, November 124609 122770 1992, November 117584 117263 Let μ1 = mean traffic count on Friday the 6th. Let μ2 = mean traffic count on Friday the 13th. Estimate the mean difference in traffic count between the 6th and the 13th using a 90% level. (i) Determine the sample mean of differences x⎯⎯di Determine the sample mean of…arrow_forwardPlease solve for G, H, and Iarrow_forward
- For each test below, describe what it is used for and to what type of data does it apply.(a) Rosner’s test(b) Grubb’s test(c) Dixon’s testarrow_forwardPLEASE ANSWER ALL PARTS OF THE QUESTION AND USE THE IMAGE FOR A GUIDE A biologist is studying the effect of fertilizer on a species of endangered plant in a specific area of land divided into 32 equal sized plots. (See diagram.) Plots numbered 1—16 are in deep shade from the trees for most of the day while periodic flooding occurs in the areas numbered 17—32. The biologist chooses 16 plots at random and applies organic fertilizer. The other plots receive non-organic fertilizer. At the end of the study period, the percentage increase in the number of this plant is measured in each plot and compared for each type of fertilizer. Is this an experiment? Briefly explain your answer. A biologist is studying the effect of fertilizer on a species of endangered plant in a specific area of land divided into 32 equal sized plots. (See diagram.) Plots numbered 1—16 are in deep shade from the trees for most of the day while periodic flooding occurs in the areas…arrow_forwardHigh-Speed Train Company The tourism director for a hlgh-speed train company was Interested in flnding out the precise time the train passed by some special landmarks. To help her figure this out, she began by collecting some data for the Palmetto traln that originates from New York City Penn Station and ends at Richmond, VA, stopping at varlous locations along the route. Palmetto - Time Distance from Train #89 cumulative NY Daily (minutes) (miles) Location of Train Stops New York, NY - Penn Station 6:15AM Newark, NJ 6:32AM 17 13 Trenton, NJ 7:06AM 51 66 7:37AM 82 96 Philadephia, PA Wilmington, DE 8:02AM 107 125 Baltimore, MD 8:54AM 159 190 Washington Dc 9:55AM 220 227 Alexandria, VA 10:12AM 237 238 Richmond, VA - Staples Mill Road 11:50AM 335 335 1. Create a graphical display showing the relationship between cumulative time and distance from New York.arrow_forward
- Q4C The British Department of Transportation studied to see if people avoid driving on Friday the 13th. They did a traffic count on a Friday and then again on a Friday the 13th at the same two locations ("Friday the 13th," 2013). The data for each location on the two different dates is in following table: Table: Traffic Count Dates 6th 13th 1990, July 139246 138548 1990, July 134012 132908 1991, September 137055 136018 1991, September 133732 131843 1991, December 123552 121641 1991, December 121139 118723 1992, March 128293 125532 1992, March 124631 120249 1992, November 124609 122770 1992, November 117584 117263 Let μ1 = mean traffic count on Friday the 6th. Let μ2 = mean traffic count on Friday the 13th. Estimate the mean difference in traffic count between the 6th and the 13th using a 90% level. (vii) Determine confidence interval of the mean difference μd Enter lower bound value…arrow_forwardThe time it takes an employee to package the components of a certain product is normally distributed with ? = 7.5 and ? = 1.5 minutes. As an incentive, management has decided to give a bonus to the 25% of employees who took the shortest amount of time to package the components. Find the amount of time taken to package the components that will indicate that an employee should get a bonus. (Round your answer to two decimal places.) An employee must package components in a time minutes.arrow_forwardTyped plz and asap Please provide MW me a quality solution show all steps and calculations take Care of plagiqrism alsoarrow_forward
- Please helparrow_forwardI'm looking for help on the first 3 bullet points please.arrow_forwardWhen manually calculating a Mann-Whitney analysis, the first step is to organize your data in numerical order, from lowest to highest. Which of the following statements is true about this step in the analysis process. Group of answer choices The data should be squared before you sum the data. The data from both groups should be combined before ranking the data. The data should be summed (added) before ranking the data. The data should be ranked with each group independently.arrow_forward
arrow_back_ios
SEE MORE QUESTIONS
arrow_forward_ios
Recommended textbooks for you
- MATLAB: An Introduction with ApplicationsStatisticsISBN:9781119256830Author:Amos GilatPublisher:John Wiley & Sons Inc
 Probability and Statistics for Engineering and th...StatisticsISBN:9781305251809Author:Jay L. DevorePublisher:Cengage Learning
 Statistics for The Behavioral Sciences (MindTap C...StatisticsISBN:9781305504912Author:Frederick J Gravetter, Larry B. WallnauPublisher:Cengage Learning
  Elementary Statistics: Picturing the World (7th E...StatisticsISBN:9780134683416Author:Ron Larson, Betsy FarberPublisher:PEARSON
 The Basic Practice of StatisticsStatisticsISBN:9781319042578Author:David S. Moore, William I. Notz, Michael A. FlignerPublisher:W. H. Freeman
 Introduction to the Practice of StatisticsStatisticsISBN:9781319013387Author:David S. Moore, George P. McCabe, Bruce A. CraigPublisher:W. H. Freeman
MATLAB: An Introduction with Applications
Statistics
ISBN:9781119256830
Author:Amos Gilat
Publisher:John Wiley & Sons Inc
Probability and Statistics for Engineering and th...
Statistics
ISBN:9781305251809
Author:Jay L. Devore
Publisher:Cengage Learning
Statistics for The Behavioral Sciences (MindTap C...
Statistics
ISBN:9781305504912
Author:Frederick J Gravetter, Larry B. Wallnau
Publisher:Cengage Learning
Elementary Statistics: Picturing the World (7th E...
Statistics
ISBN:9780134683416
Author:Ron Larson, Betsy Farber
Publisher:PEARSON
The Basic Practice of Statistics
Statistics
ISBN:9781319042578
Author:David S. Moore, William I. Notz, Michael A. Fligner
Publisher:W. H. Freeman
Introduction to the Practice of Statistics
Statistics
ISBN:9781319013387
Author:David S. Moore, George P. McCabe, Bruce A. Craig
Publisher:W. H. Freeman