Campbell Essential Biology (7th Edition)
7th Edition
ISBN: 9780134765037
Author: Eric J. Simon, Jean L. Dickey, Jane B. Reece
Publisher: PEARSON
expand_more
expand_more
format_list_bulleted
Concept explainers
Videos
Textbook Question
Chapter 5, Problem 16PS
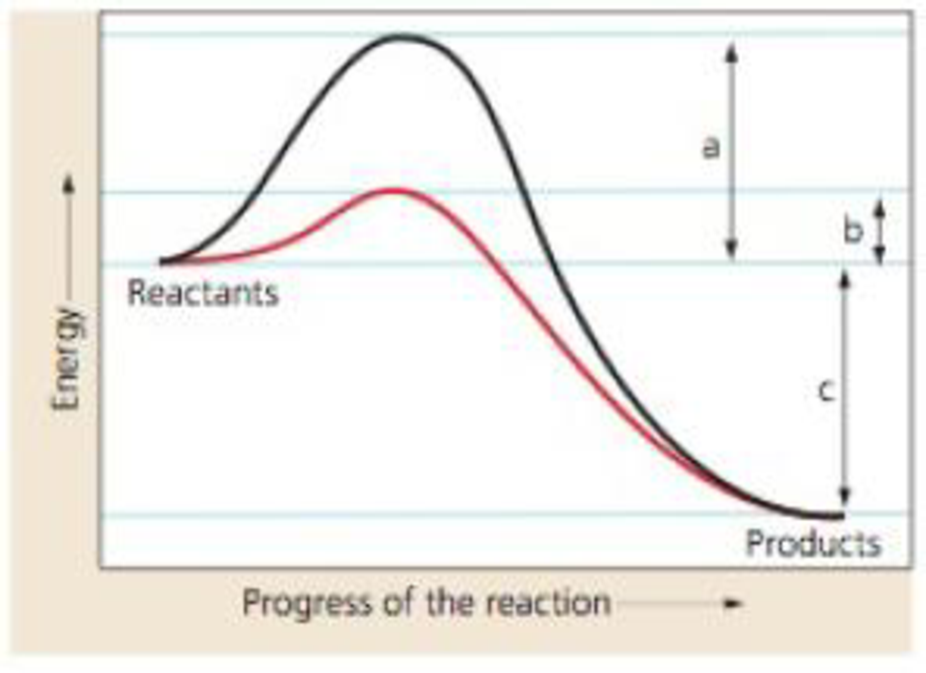
Interpreting Data The graph illustrates two
Expert Solution & Answer
Want to see the full answer?
Check out a sample textbook solution
Students have asked these similar questions
ENZYME CATALYSIS lab
Construct a hypothesis addressing the effect concentration will have on rate of reaction.
What chemical reaction is being catalyzed in the experiment? Label the substrate(s), enzyme and product(s).
Practice
Mira Gendy
1 of 1
Directions: This short free-response question requires about 6 minutes to answer. The question is worth 3 points. Read the question carefully and completely. Answers must be written
out in paragraph form. Outlines, bulleted lists, or diagrams alone are not acceptable.
II
Substrate Concentration [S]
The graph above shows the initial rate of an enzyme-catalyzed reaction at different substrate concentrations in the presence of a constant concentration of the enzyme.
Connect the primary structure of the enzyme to its overall shape.
I U
x X2 5
Initial Rate of Reaction
Graph B above depicts Lineweaver-Burk double reciprocal plot for an enzyme catalyzed reaction carried out in the presence or absence of an inhibitor. Which of the following statement best describes the kinetic data shown below: ?
Line 1 depicts the enzyme-catalyzed reaction carried out in the presence of a competitive inhibitor.
Line 1 depicts the enzyme-catalyzed reaction carried out in the presence of a noncompetitive inhibitor.
Line 2 depicts the enzyme-catalyzed reaction carried out in the presence of a competitive inhibitor.
Line 2 depicts the enzyme-catalyzed reaction carried out in the presence of a noncompetitive inhibitor.
Chapter 5 Solutions
Campbell Essential Biology (7th Edition)
Ch. 5 - Prob. 1SQCh. 5 - _____ is the capacity to perform work, while _____...Ch. 5 - The label on a candy bar says that it contains 150...Ch. 5 - Prob. 4SQCh. 5 - Prob. 5SQCh. 5 - Prob. 6SQCh. 5 - Prob. 7SQCh. 5 - Prob. 8SQCh. 5 - Prob. 9SQCh. 5 - Prob. 10SQ
Ch. 5 - Prob. 11IMTCh. 5 - For each statement, identify which major theme is...Ch. 5 - For each statement, identify which major theme is...Ch. 5 - HIV, the virus that causes AIDS, depends on an...Ch. 5 - Interpreting Data The graph illustrates two...Ch. 5 - Prob. 17BSCh. 5 - Nanotechnology devices can improve human health....Ch. 5 - Prob. 19BS
Additional Science Textbook Solutions
Find more solutions based on key concepts
Some people consider Pasteur or Koch to be the Father of Microbiology, rather than Leeuwenhoek. Why might they ...
Microbiology with Diseases by Body System (4th Edition)
How does the removal of hydrogen atoms from nutrient molecules result in a loss of energy from the nutrient mol...
Seeley's Anatomy & Physiology
CAUTION How can evolutionary fitness be estimated? a. Document how long individuals survive. b. Count the numbe...
Biological Science (6th Edition)
2. A gene is a segment of DNA that has the information to produce a functional product. The functional product ...
Genetics: Analysis and Principles
Why is it unlikely that two neighboring water molecules would be arranged like this?
Campbell Biology (10th Edition)
Describe the evolution of mammals, tracing their synapsid lineage from early amniote ancestors to true mammals....
LooseLeaf for Integrated Principles of Zoology
Knowledge Booster


Learn more about
Need a deep-dive on the concept behind this application? Look no further. Learn more about this topic, biology and related others by exploring similar questions and additional content below.Similar questions
- MAKE A GRAPH FOR ME ON GRAPH PAPER CALL IT ENZYMES VS RATE OF REACTION USING TABLE BELOW GRAPH paper INSERTED BELOW rules: data points must be an x or circled dot, must be on grid paper , the independant variable on the x axis and dependant variable on the y axis, must include titles Regarding the data points: - H2O2 + MnO2 Control #1: (Control #1, 5)- H2O2 + sand control #2: (Control #2, 0)- Plant versus Animal Liver Catalase: (Liver, 4)- Potato: Plant vs. Animal Catalase: (Potato, 3)- Substance Enzyme Concentration (Used Liver): (Liver Used, 4)- Substance Enzyme Concentration (Used H2O2): (Used H2O2, 1) - Boiling Water Bath Temperature: (Boiling Water Bath, 5)- Ice Water Bath Temperature: (Ice Water Bath, 2)- HCl, or pH 3: (H 3, 4)- NaOH at pH 12: (pH 12, 2)- pH 7 (H2O): (assuming average of pH readings; pH 7, not specified) The following explains how to display the graph: Title: Factors versus Enzyme Activity Rate - Labels on X- and Y-axes: Factors and Rate of Enzyme…arrow_forward3.1 In the picture below label the following: substrate, active site, enzyme, product. Briefly explain what is happening in each picture (figure 6.16 will be VERY helpful). 3.2 Below is a graph showing how enzymes affect the energy of a reaction. Label the following in the graph (reactants, products, activation energy with no enzyme, activation energy with enzymes, time, energy)arrow_forwardTrue/False Question: Enzymes do not shift the equilibrium of the reactions that they catalyze. O True O ralsearrow_forward
- an enzyme acts on a substrate X. The enzyme exists in four different forms, with different catalytic efficiencies. The table shows the kcatand KM values for each form of the enzyme. If the concentration of substrate X in a solution is 5 µM, which of the four forms of the enzyme is the most efficient? Form of Enzyme kcat (s-1) KM (µM) A 50 10 B 50 1 C 100 4 D 1000 100 a. Form A b. Form B c. Form D d. Form Carrow_forwardWhich of the two graphs, below, represents an enzyme catalyzed version of the reaction Y-->X? Utilizing your understanding of enzyme function, clearly explain why you chose your answer. activation energy for reaction Y-X activation energy for reaction Y X reactant reactant product product (A) uncatalyzed reaction pathway enzyme-catalyzed reaction pathway (8) total energy- total energyarrow_forwardGiven: Your professor gives you a vial of enzyme and a vial of substrate. The product of this reaction is fluorescent and you can measure the concentration of the product as a function of time. (answer a, b, and c)a) Your professor tells you to quantify how much product is being produced per minute at thebeginning of the experiment. What exactly are you measuring?b) On the same plot, show the kinetic curve for an increased quantity of enzyme. Assume a 2x concentration. Indicate Km and Vmax.c) You don’t have a computer hand. Sad. How can you plot the data such that you can get important Michaelis-Menten values?arrow_forward
- Rearrange the following terms to show the process of enzymatic reaction. Use and + to complete the equation. enzyme enzyme-substrate complex enzyme product substrate Several important things should be noted about this reaction: 1. A/an because of the fit between their structures; 2. As a result, something happens to the example, it might be split in two at a particular location. 3. Then the and 4. The enzyme is again. 5. Note that the arrows in the formula for enzyme reaction point acts on a specific to form a/an molecule. For comes apart, yielding the in the reaction and is now free to react _- This means that the reaction is 6. An enzyme-substrate complex can simply go back to the the 7. The products of an enzymatic reaction can react with the enzyme to form the and again; 8. It, in turn, may again form the 9. Therefore, the same. and the may act to cause a to go either way.arrow_forwardEnzyme X and enzyme Y catalyze the same reaction and exhibit the νo versus [S] curves shown below. Which enzyme is more effi cient at low [S]? Which is more effi cient at high [S]?arrow_forwardWhich statements are false? Initial velocities of enzyme reactions are best obtained in the absence of product because it simplifies analysis. Initial velocities refer to the velocity of the reaction right after it is initiated. The velocity of the reaction as a function of measuring time are curved just like an isothermal binding curve because of substrate binding to the enzyme. Initial velocities correspond to the pre-steady state condition for free enzyme. Initial velocities can sometimes be measured by spectroscopy such as UV/Vis spectroscopy when monitoring the production of NADH from NAD+. The velocity of the reaction will eventually go to zero. The reaction will reach equilibrium because of the presence of the enzyme. It is always better to use substrate rather than product to measure enzyme kinetics.arrow_forward
- Below is kinetic data obtained for an enzyme-catalyzed reaction. The enzyme concentration is fixed at 100 nM. Using a Lineweaver-Burke plot, calculate the Km value for this reaction. Report your answer to three significant figures in units of uM.arrow_forwardBelow is kinetic data obtained for an enzyme-catalyzed reaction. The enzyme concentration is fixed at 100 nM. Using a Lineweaver-Burke plot, calculate the kcat value for this reaction. Report your answer to three significant figures in units of 1/sec.arrow_forwardusing the method for experiment below and the table conduct 1 graph of the different factors vs rate of enzyme activity. The experiment began by preparing a hot water bath by boiling water and an ice water bath using ice in a 400 mL beaker. In the control group, 2 mL of 3% H2O2 was placed in a test tube and a pinch of MnO2 was added. The rate of this reaction was assigned as 5, and the production of bubbles in millimeters (mm) was noted. The reaction was considered complete when no more bubbles were produced. Another control group was set up by placing 2 mL of 3% H2O2 in a test tube and adding a pinch of sand, with the rate of reaction assigned as 0. To investigate the difference between plant and animal catalase, 2 mL of H2O2 was added to a test tube and a small piece of fresh liver was added. The rate of reaction between 0-5 was noted, along with the production of bubbles in mm. The same procedure was repeated using a small piece of fresh potato. Next, the effect of…arrow_forward
arrow_back_ios
SEE MORE QUESTIONS
arrow_forward_ios
Recommended textbooks for you
 Human Anatomy & Physiology (11th Edition)BiologyISBN:9780134580999Author:Elaine N. Marieb, Katja N. HoehnPublisher:PEARSON
 Biology 2eBiologyISBN:9781947172517Author:Matthew Douglas, Jung Choi, Mary Ann ClarkPublisher:OpenStax
 Anatomy & PhysiologyBiologyISBN:9781259398629Author:McKinley, Michael P., O'loughlin, Valerie Dean, Bidle, Theresa StouterPublisher:Mcgraw Hill Education,
 Molecular Biology of the Cell (Sixth Edition)BiologyISBN:9780815344322Author:Bruce Alberts, Alexander D. Johnson, Julian Lewis, David Morgan, Martin Raff, Keith Roberts, Peter WalterPublisher:W. W. Norton & Company
 Laboratory Manual For Human Anatomy & PhysiologyBiologyISBN:9781260159363Author:Martin, Terry R., Prentice-craver, CynthiaPublisher:McGraw-Hill Publishing Co.
 Inquiry Into Life (16th Edition)BiologyISBN:9781260231700Author:Sylvia S. Mader, Michael WindelspechtPublisher:McGraw Hill Education
Human Anatomy & Physiology (11th Edition)
Biology
ISBN:9780134580999
Author:Elaine N. Marieb, Katja N. Hoehn
Publisher:PEARSON
Biology 2e
Biology
ISBN:9781947172517
Author:Matthew Douglas, Jung Choi, Mary Ann Clark
Publisher:OpenStax
Anatomy & Physiology
Biology
ISBN:9781259398629
Author:McKinley, Michael P., O'loughlin, Valerie Dean, Bidle, Theresa Stouter
Publisher:Mcgraw Hill Education,
Molecular Biology of the Cell (Sixth Edition)
Biology
ISBN:9780815344322
Author:Bruce Alberts, Alexander D. Johnson, Julian Lewis, David Morgan, Martin Raff, Keith Roberts, Peter Walter
Publisher:W. W. Norton & Company
Laboratory Manual For Human Anatomy & Physiology
Biology
ISBN:9781260159363
Author:Martin, Terry R., Prentice-craver, Cynthia
Publisher:McGraw-Hill Publishing Co.
Inquiry Into Life (16th Edition)
Biology
ISBN:9781260231700
Author:Sylvia S. Mader, Michael Windelspecht
Publisher:McGraw Hill Education
Enzyme Kinetics; Author: MIT OpenCourseWare;https://www.youtube.com/watch?v=FXWZr3mscUo;License: Standard Youtube License