
Related questions
using the method for experiment below and the table conduct 1 graph of the different factors vs rate of enzyme activity.
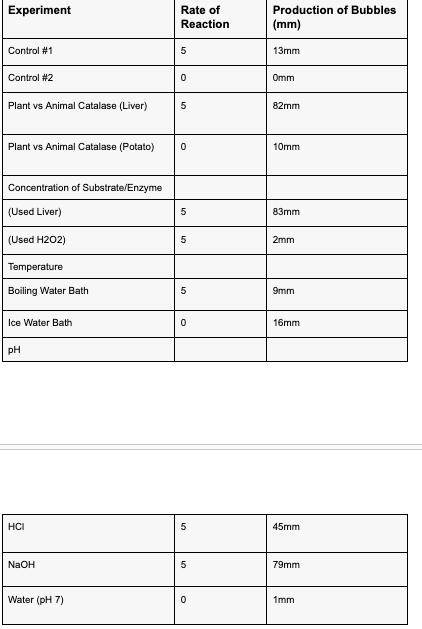
The experiment began by preparing a hot water bath by boiling water and an ice water bath using ice in a 400 mL beaker. In the control group, 2 mL of 3% H2O2 was placed in a test tube and a pinch of MnO2 was added. The rate of this reaction was assigned as 5, and the production of bubbles in millimeters (mm) was noted. The reaction was considered complete when no more bubbles were produced. Another control group was set up by placing 2 mL of 3% H2O2 in a test tube and adding a pinch of sand, with the
To investigate the difference between plant and animal catalase, 2 mL of H2O2 was added to a test tube and a small piece of fresh liver was added. The rate of reaction between 0-5 was noted, along with the production of bubbles in mm. The same procedure was repeated using a small piece of fresh potato.
Next, the effect of substrate/enzyme concentration was examined. 2 mL of H2O2 was placed in a test tube and a small piece of fresh liver was added. The reaction was allowed to complete, and then the liver was removed, keeping the H2O2 for the next step. 2 mL of fresh H2O2 was added to the test tube containing the used liver from the previous step, and the rate of reaction between 0-5 was noted. Additionally, a small piece of fresh liver was added to the used H2O2 in the test tube from step 6, and the rate of reaction between 0-5 was recorded.
For the temperature experiment, 2 mL of H2O2 was placed in a test tube and the test tube was briefly submerged in the boiling water bath to heat up. Then, a small piece of fresh liver was added, and the rate of reaction between 0-5 was observed. The same procedure was repeated using an ice water bath instead of the boiling water bath.
Lastly, the effect of pH was investigated. Three test tubes were prepared, each containing a sample of ground liver. To test tube #1, 1 mL of 0.1 M HCl was added, while test tube #2 received 1 mL of 0.1 M NaOH, and test tube #3 was filled with 1 mL of distilled water. pH paper was added to each test tube, followed by 2 mL of H2O2. The rate of reaction between 0-5 and the production of bubbles in mm were recorded for each test tube.


Step by stepSolved in 2 steps with 1 images


- Most of the enzyme reactions followed the mathematical kinetic plots suggested by the Michaelis-Menten plots:viii. Draw another Lineweaver-Burk plot and on the same plot, draw a graphto indicate un-competitive inhibition.Note: In the graphs, lable Vmax and KM clearly.arrow_forwardPlease handraw this graph with all the necessary detailed information: Imagine that I text enzyme rate for four different temperatures: 10 degrees celsius, 20 degrees celsisus, 30 degree celsius, and 40 degree celsius, in separate tubes. The enzyme appears to work faster as temperature increases, but completely ceases activity at 40 degrees celcius. Sketch a graph to show this outcome, but here you will graph product formation (nmoles/mL) vs. time (minutes). The graph should be 4 lines and HANDDRAWN. Include a legend if necessary. You do not need precise quantitivate values, but most show the correct trends on the graph.arrow_forwardAn uncatalyzed reaction has keq=50. in the presence of an appropriate enzyme.the forward rate of the reaction increased by 20-fold.what is the equilibrium constant in the presence of the enzyme?arrow_forward
- Below is kinetic data obtained for an enzyme-catalyzed reaction. The enzyme concentration is fixed at 100 nM. Using a Lineweaver-Burke plot, calculate the kcat value for this reaction. Report your answer to three significant figures in units of 1/sec.arrow_forwardFrom the chart below, comment on the temperature dependence of this enzyme catalyzed reaction.arrow_forwardUsing the table below can you please help me answer the following. Based on your results, what can you conclude about the effect of enzyme concentration on reaction rate? Explainarrow_forward
- For an enzyme kinetics experiment, a student prepared a reaction mixture by mixing 450 microliters of 0.75mM PNPP with 4.25ml of 0.2M Tris-HCl buffer. When he is ready to measure the absorbance, he added 0.3ml of Alkaline Phosphatase to the mixture and mixed thoroughly. What is the substrate concentration at the beginning of the reaction in mM ?arrow_forwardYou run a series of assays at 25°C on enzyme A. You measure the velocity for a range of S concentrations. What is the Km (in mM) for Enzyme A?arrow_forwardKnowing that for a bacterial colony to be able to grow it must produce product "3" AND "4", use the information in the image to describe which enzyme(s) are that are Non-Functional in Colony C? Please note error in enzyme description at bottom of image. X converts 1 into 2; Y converts 1 into 3; and z converts 2 into 4.arrow_forward
- Draw the Michaelis-Menten graph you would predict for the enzyme using 50 nM and 100 nM of enzyme in your assays.arrow_forwardYou design an enzyme assay and choose a substrate concentration equal to the Km of the enzymatic reaction. You measure the rate of the reaction at this substrate concentration to be 75.0 μmol/min. Calculate the Vmax of this reaction in μmol/min. Express your answer with one decimal place. Your previous attempt suffered from low signal-to-noise ratio when you used a substrate concentration equal to the Km. So you decide to increase the substrate concentration to 0.45 mM. You remeasure the rate of the reaction at this new substrate concentration and find it to be 135.0 μmol/min. Using the same Vmax value found above, calculate the Km value of this enzymatic reaction. Express your answer in μM with one decimal place. Considering the previous two questions, what would be the rate of the reaction at a substrate concentration of 0.01 mM? Express your answer in μmol/min with one decimal place.arrow_forwardConsider the following free energy diagram for an uncatalyzed and enzyme-catalyzed reaction. Select all the statements that are true. Without enzyme With enzyme A+B Time AB Oa. The reaction is now spontaneous due to the addition of enzyme b. The rate of the enzyme catalyzed reaction is faster than the uncatalyzed reaction O C. The reaction is exergonic O d. The change in free energy for the reaction is greater in the catalyzed reaction, compared to the uncatalyzed reaction e. The enzyme stabilizes the transition state for the reaction Released Energy pesarrow_forward
- Human Anatomy & Physiology (11th Edition)BiologyISBN:9780134580999Author:Elaine N. Marieb, Katja N. HoehnPublisher:PEARSON
 Biology 2eBiologyISBN:9781947172517Author:Matthew Douglas, Jung Choi, Mary Ann ClarkPublisher:OpenStax
 Anatomy & PhysiologyBiologyISBN:9781259398629Author:McKinley, Michael P., O'loughlin, Valerie Dean, Bidle, Theresa StouterPublisher:Mcgraw Hill Education,
  Molecular Biology of the Cell (Sixth Edition)BiologyISBN:9780815344322Author:Bruce Alberts, Alexander D. Johnson, Julian Lewis, David Morgan, Martin Raff, Keith Roberts, Peter WalterPublisher:W. W. Norton & Company
 Laboratory Manual For Human Anatomy & PhysiologyBiologyISBN:9781260159363Author:Martin, Terry R., Prentice-craver, CynthiaPublisher:McGraw-Hill Publishing Co.
 Inquiry Into Life (16th Edition)BiologyISBN:9781260231700Author:Sylvia S. Mader, Michael WindelspechtPublisher:McGraw Hill Education