
Concept explainers
Videos
a.
To use : the regression feature of a graphing utility to find the logistic model and power model for the data
a.
Answer to Problem 38E
The logistic model is
Explanation of Solution
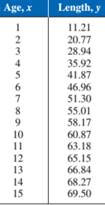
Given information : The table provided in the question is shown below

Calculation :
Using the graphing utility
The logistic model
The power model
b.
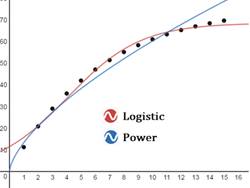
To use : part (a) to determine which model better fits to the data
b.
Answer to Problem 38E
The logistic model is better fits to the data
Explanation of Solution
Given information : The table provided in the question is shown below

Graph : Sketch the graph using graphing utility.
Step 1: Press WINDOW button to access the Window editor.
Step 2: Press
Step 3: Enter the data
Step 4: Press
The graph is obtained as:
c.
To predict : the length of
c.
Answer to Problem 38E
The length of
Explanation of Solution
Given information : The table provided in the question is shown below
Calculation :
Chapter 3 Solutions
Precalculus with Limits: A Graphing Approach


 Calculus: Early TranscendentalsCalculusISBN:9781285741550Author:James StewartPublisher:Cengage Learning
 Thomas' Calculus (14th Edition)CalculusISBN:9780134438986Author:Joel R. Hass, Christopher E. Heil, Maurice D. WeirPublisher:PEARSON
 Calculus: Early Transcendentals (3rd Edition)CalculusISBN:9780134763644Author:William L. Briggs, Lyle Cochran, Bernard Gillett, Eric SchulzPublisher:PEARSON
 Calculus: Early TranscendentalsCalculusISBN:9781319050740Author:Jon Rogawski, Colin Adams, Robert FranzosaPublisher:W. H. Freeman
 Calculus: Early Transcendental FunctionsCalculusISBN:9781337552516Author:Ron Larson, Bruce H. EdwardsPublisher:Cengage Learning