
Videos
a.
In what year would
a.
Answer to Problem 152E
In
Explanation of Solution
Given information : The question is
The data can be modeled by the logarithmic function
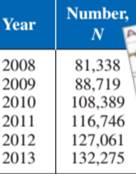
Calculation:
b.
To use : the graphing utility to graph the function by using part (a)
b.
Explanation of Solution
Given information : The question is
The data can be modeled by the logarithmic function

Graph : Sketch the graph using graphing utility.
Step 1: Press WINDOW button to access the Window editor.
Step 2: Press
Step 3: Enter the expression
Step 4: Press
The graph is obtained as:
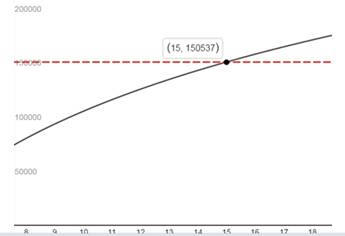
Interpretation :
From the above graph the blue line shows the function
c.
Is this model is good for predicting future values
c.
Answer to Problem 152E
Yes, this model is good for predicting future values
Explanation of Solution
Given information : The question is
The data can be modeled by the logarithmic function
From the above graph Yes, this model is good for predicting future values because the trend seems to be increasing every year
Chapter 3 Solutions
Precalculus with Limits: A Graphing Approach


 Calculus: Early TranscendentalsCalculusISBN:9781285741550Author:James StewartPublisher:Cengage Learning
 Thomas' Calculus (14th Edition)CalculusISBN:9780134438986Author:Joel R. Hass, Christopher E. Heil, Maurice D. WeirPublisher:PEARSON
 Calculus: Early Transcendentals (3rd Edition)CalculusISBN:9780134763644Author:William L. Briggs, Lyle Cochran, Bernard Gillett, Eric SchulzPublisher:PEARSON
 Calculus: Early TranscendentalsCalculusISBN:9781319050740Author:Jon Rogawski, Colin Adams, Robert FranzosaPublisher:W. H. Freeman
 Calculus: Early Transcendental FunctionsCalculusISBN:9781337552516Author:Ron Larson, Bruce H. EdwardsPublisher:Cengage Learning