
Concept explainers
Videos
a.
To use : the regression feature of a graphing utility to find a logistic model for the data
a.
Answer to Problem 134RE
The logistic model for the data is
Explanation of Solution
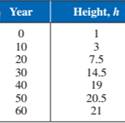
Given information : The table of the data shown below

Calculation :
Using a graphing utility
The logistic model
b.
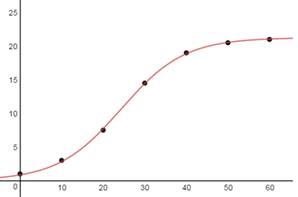
To use : the graphing utility to graph the data
b.
Explanation of Solution
Given information : The table of the data shown below

Graph : Sketch the graph using graphing utility.
Step 1: Press WINDOW button to access the Window editor.
Step 2: Press
Step 3: Enter the data
Step 4: Press
The graph is obtained as:
c.
how closely the model represent the data
c.
Answer to Problem 134RE
The logistic model represents the data
Explanation of Solution
Given information : The table of the data shown below
The logistic model is better fits for the data
d.
What is the limiting height of the tree
d.
Answer to Problem 134RE
The limiting height of the tree is
Explanation of Solution
Given information : The table of the data shown below

Calculation :
The limiting value of a logistic model is
Therefore, the limiting height is
Chapter 3 Solutions
Precalculus with Limits: A Graphing Approach


 Calculus: Early TranscendentalsCalculusISBN:9781285741550Author:James StewartPublisher:Cengage Learning
 Thomas' Calculus (14th Edition)CalculusISBN:9780134438986Author:Joel R. Hass, Christopher E. Heil, Maurice D. WeirPublisher:PEARSON
 Calculus: Early Transcendentals (3rd Edition)CalculusISBN:9780134763644Author:William L. Briggs, Lyle Cochran, Bernard Gillett, Eric SchulzPublisher:PEARSON
 Calculus: Early TranscendentalsCalculusISBN:9781319050740Author:Jon Rogawski, Colin Adams, Robert FranzosaPublisher:W. H. Freeman
 Calculus: Early Transcendental FunctionsCalculusISBN:9781337552516Author:Ron Larson, Bruce H. EdwardsPublisher:Cengage Learning