
Concept explainers
Videos
a.
To use : the graphing utility to graph the function for the years
a.
Explanation of Solution
Given information : The question is
The projected populations of California for the years
Graph : Sketch the graph using graphing utility.
Step 1: Press WINDOW button to access the Window editor.
Step 2: Press
Step 3: Enter the data
Step 4: Press
The graph is obtained as:
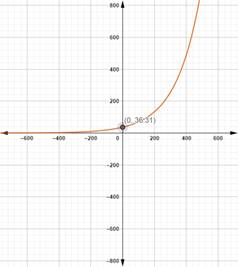
Interpretation: from the above graph it is observed that the y-intercept is
b.
To use : the table feature of the graphing utility of part (a)
b.
Explanation of Solution
Given information : The question is
The projected populations of California for the years
Calculation :
| 20 | 41.348 |
| 25 | 42.714 |
| 30 | 44.123 |
| 35 | 45.583 |
| 40 | 47.088 |
| 45 | 48.644 |
| 50 | 50.251 |
| 55 | 51.911 |
| 60 | 53.626 |
c.
in what year the population of California exceed
c.
Answer to Problem 81E
In
Explanation of Solution
Given information : The question is
The projected populations of California for the years
Calculation :
From the graph the population will exceed
So, in
Chapter 3 Solutions
Precalculus with Limits: A Graphing Approach


 Calculus: Early TranscendentalsCalculusISBN:9781285741550Author:James StewartPublisher:Cengage Learning
 Thomas' Calculus (14th Edition)CalculusISBN:9780134438986Author:Joel R. Hass, Christopher E. Heil, Maurice D. WeirPublisher:PEARSON
 Calculus: Early Transcendentals (3rd Edition)CalculusISBN:9780134763644Author:William L. Briggs, Lyle Cochran, Bernard Gillett, Eric SchulzPublisher:PEARSON
 Calculus: Early TranscendentalsCalculusISBN:9781319050740Author:Jon Rogawski, Colin Adams, Robert FranzosaPublisher:W. H. Freeman
 Calculus: Early Transcendental FunctionsCalculusISBN:9781337552516Author:Ron Larson, Bruce H. EdwardsPublisher:Cengage Learning