
Videos
a.
To use : a graphing utility to graph the model
a.
Explanation of Solution
Given information : The question is
The number
Graph : Sketch the graph using graphing utility.
Step 1: Press WINDOW button to access the Window editor.
Step 2: Press
Step 3: Enter the expression
Step 4: Press
The graph is obtained as:
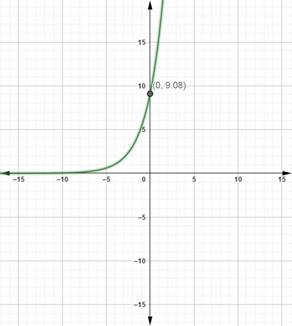
Interpretation: from the above graph it is observed that the function
b.
To predict : the population of
b.
Answer to Problem 46E
The population of
Explanation of Solution
Given information : The question is
The number
Calculation :
c.
What is the limiting value of the population
c.
Answer to Problem 46E
The limiting value of the population is
Explanation of Solution
Given information : The question is
The number
Calculation :
The horizontal asymptote are
d.
Why do you think this population of yeast follows a logistic growth model instead of an exponential growth model
d.
Answer to Problem 46E
The curve follows the logistic growth model
Explanation of Solution
Given information : The question is
The number
Calculation :
The population of yeast in a culture is determined by its capacity and as the population rises the death also rise and hence the curve follows the logistic growth model
Chapter 3 Solutions
Precalculus with Limits: A Graphing Approach


 Calculus: Early TranscendentalsCalculusISBN:9781285741550Author:James StewartPublisher:Cengage Learning
 Thomas' Calculus (14th Edition)CalculusISBN:9780134438986Author:Joel R. Hass, Christopher E. Heil, Maurice D. WeirPublisher:PEARSON
 Calculus: Early Transcendentals (3rd Edition)CalculusISBN:9780134763644Author:William L. Briggs, Lyle Cochran, Bernard Gillett, Eric SchulzPublisher:PEARSON
 Calculus: Early TranscendentalsCalculusISBN:9781319050740Author:Jon Rogawski, Colin Adams, Robert FranzosaPublisher:W. H. Freeman
 Calculus: Early Transcendental FunctionsCalculusISBN:9781337552516Author:Ron Larson, Bruce H. EdwardsPublisher:Cengage Learning