
Videos
a)
To check the assumptions and conditions for inference.
a)
Answer to Problem 42E
All conditions satisfied.
Explanation of Solution
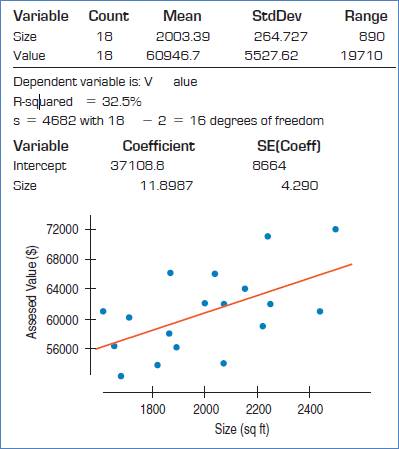
Given:

The conditions are: straight enough, Independence, Randomization, Random residual, Does plot thicken? and Nearly normal condition.
We will check it one by one.
Straight enough condition: Satisfied, because no curvature is present in the
Independence assumption: Satisfied, because the 18 homes are less than 10% of the population of all homes.
Randomization condition: Satisfied, as homes were randomly selected.
Random residuals condition: Satisfied, because there is no obvious pattern in the residual plot.
Does the plot thicken? condition: Satisfied, because the vertical spread in the residual plot is not increasing or decreasing.
b)
To perform the hypothesis test.
b)
Answer to Problem 42E
There is sufficient evidence that the slope is non zero and there is association between size and the assessed value.
Explanation of Solution
Given:

Formula:
Test statistic:
The null and alternative hypotheses:
Test statistic:
The degrees of freedom = df = 16
Therefore, p-value would be,
P-value = 0.0135 …Using excel formula, =TDIST(2.774,16,2)
Decision: P-value < 0.05, reject H0.
Conclusion: There is sufficient evidence that the slope is non zero and there is association between size and the assessed value.
c)
To explain the percentage of the variability in assessed value is explained by this regression.
c)
Answer to Problem 42E
32.5% of the variation in the assessed values has been explained by model.
Explanation of Solution
Given:

The R-square = 32.5%.
Hence, the 32.5% of the variation in the assessed values has been explained by model.
d)
To find the 90% confidence interval for the slope of the regression line.
d)
Answer to Problem 42E
We are 90% confident that the assessed value increases between 4.4085 and 19.3890.
Explanation of Solution
Given:

Formula:
Confidence interval for slope is,
The confidence level = 0.90
So, level of significance =
First need to find critical t value.
tc = 1.746 …Using excel formula, =TINV(0.10,16)
Using formula, 90% confidence interval for the slope of the regression line.
Therefore, we are 90% confident that the assessed value increases between 4.4085 and 19.3890.
e)
To explain whether we conclude that adding a room to your house will increase its assessed value.
e)
Answer to Problem 42E
No.
Explanation of Solution
Given:
The association does not mean causation. Therefore, adding a room does not necessarily cause an increase in the assessed value. There might be possibility that the confounding variable affect it.
f)
To explain whether assessed value $70,200 is too high.
f)
Answer to Problem 42E
Yes, the assessed value $70,200 is too high.
Explanation of Solution
Given:

The regression equation is,
The value
Therefore, $70,200 is higher than $62096.07. Hence, it is too high.
Chapter 27 Solutions
Stats: Modeling the World Nasta Edition Grades 9-12
Additional Math Textbook Solutions
STATS:DATA+MODELS-W/DVD
Statistics: The Art and Science of Learning from Data (4th Edition)
Basic Business Statistics, Student Value Edition (13th Edition)
Essentials of Statistics, Books a la Carte Edition (5th Edition)
Elementary Statistics
Introductory Statistics


 MATLAB: An Introduction with ApplicationsStatisticsISBN:9781119256830Author:Amos GilatPublisher:John Wiley & Sons Inc
 Probability and Statistics for Engineering and th...StatisticsISBN:9781305251809Author:Jay L. DevorePublisher:Cengage Learning
 Statistics for The Behavioral Sciences (MindTap C...StatisticsISBN:9781305504912Author:Frederick J Gravetter, Larry B. WallnauPublisher:Cengage Learning
 Elementary Statistics: Picturing the World (7th E...StatisticsISBN:9780134683416Author:Ron Larson, Betsy FarberPublisher:PEARSON
 The Basic Practice of StatisticsStatisticsISBN:9781319042578Author:David S. Moore, William I. Notz, Michael A. FlignerPublisher:W. H. Freeman
 Introduction to the Practice of StatisticsStatisticsISBN:9781319013387Author:David S. Moore, George P. McCabe, Bruce A. CraigPublisher:W. H. Freeman