
Concept explainers
Videos
a)
To fit the regression model.
a)
Answer to Problem 38E
Explanation of Solution
Given:
| Midterm 1 | Midterm 2 | Homework | Total Midterm |
| 82 | 30 | 61 | 112 |
| 96 | 68 | 72 | 164 |
| 57 | 82 | 69 | 139 |
| 89 | 92 | 84 | 181 |
| 88 | 86 | 84 | 174 |
| 93 | 81 | 71 | 174 |
| 90 | 83 | 79 | 173 |
| 83 | 21 | 51 | 104 |
| 59 | 62 | 58 | 121 |
| 89 | 57 | 79 | 146 |
| 83 | 86 | 78 | 169 |
| 95 | 75 | 77 | 170 |
| 81 | 66 | 66 | 147 |
| 86 | 63 | 74 | 149 |
| 81 | 86 | 76 | 167 |
| 81 | 87 | 75 | 168 |
| 98 | 96 | 84 | 194 |
| 50 | 27 | 20 | 77 |
| 91 | 83 | 71 | 174 |
| 87 | 89 | 85 | 176 |
| 90 | 91 | 68 | 181 |
| 95 | 82 | 68 | 177 |
| 91 | 37 | 54 | 128 |
| 93 | 81 | 82 | 174 |
| 88 | 66 | 82 | 154 |
| 99 | 90 | 77 | 189 |
| 89 | 92 | 68 | 181 |
| 87 | 62 | 72 | 149 |
| 92 | 66 | 78 | 158 |
| 62 | 43 | 56 | 105 |
| 93 | 87 | 80 | 180 |
| 95 | 93 | 87 | 188 |
| 93 | 65 | 66 | 158 |
| 92 | 98 | 77 | 190 |
| 91 | 95 | 83 | 186 |
| 92 | 80 | 82 | 172 |
| 61 | 58 | 65 | 119 |
| 55 | 65 | 51 | 120 |
| 76 | 88 | 67 | 164 |
| 63 | 62 | 67 | 125 |
| 89 | 66 | 72 | 155 |
| 91 | 42 | 66 | 133 |
| 90 | 85 | 78 | 175 |
| 75 | 62 | 72 | 137 |
| 75 | 46 | 72 | 121 |
| 91 | 65 | 77 | 156 |
| 84 | 70 | 70 | 154 |
| 94 | 92 | 81 | 186 |
| 93 | 78 | 72 | 171 |
| 91 | 58 | 66 | 149 |
| 91 | 61 | 79 | 152 |
| 89 | 86 | 62 | 175 |
| 98 | 92 | 83 | 190 |
| 96 | 51 | 83 | 147 |
| 95 | 95 | 87 | 190 |
| 98 | 89 | 77 | 187 |
| 89 | 79 | 44 | 168 |
| 93 | 89 | 73 | 182 |
| 74 | 64 | 72 | 138 |
| 97 | 96 | 80 | 193 |
| 94 | 90 | 88 | 184 |
| 81 | 89 | 62 | 170 |
| 94 | 85 | 76 | 179 |
| 92 | 90 | 86 | 182 |
Using excel,
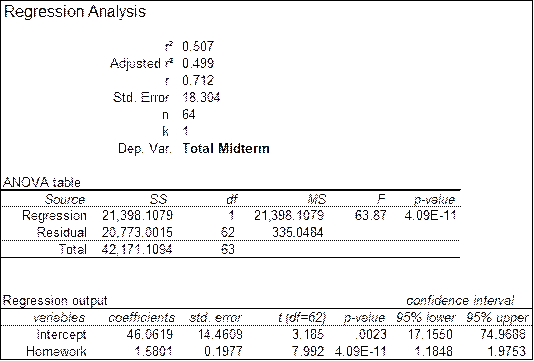
The general regression equation is,
Here,
Therefore, the equation of regression line is,
b)
To check the assumptions and conditions for inference.
b)
Answer to Problem 38E
All conditions satisfied.
Explanation of Solution
Given:

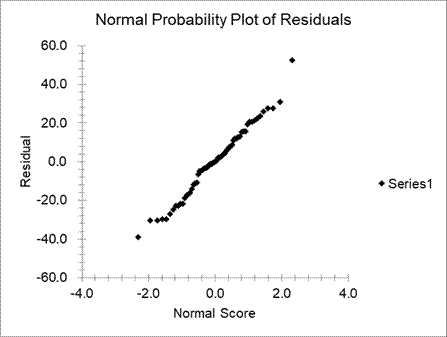
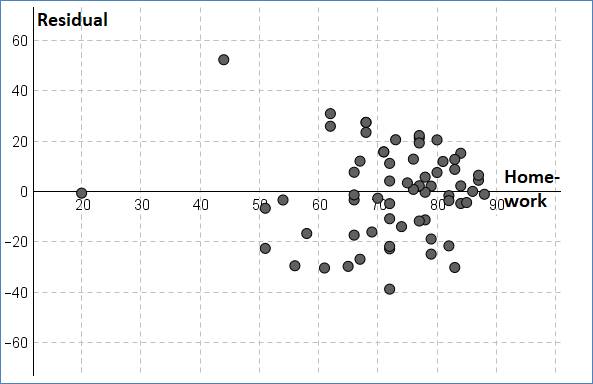
The conditions are: straight enough, Independence, Constant variance and Normal residual.
We will check it one by one.
Straight enough condition: Satisfied, because no curvature is present in the
Independence assumption: Satisfied, because there is no obvious pattern in the residual plot.
Constant variance: Satisfied, because the vertical spread in the residual plot is not increasing or decreasing.
Random residuals condition: Satisfied, because there is no obvious pattern in the residual plot.
Nearly normal condition: Satisfied, because the pattern in the normal probability plot of residual is roughly linear.
Hence, all the conditions satisfied.
Now, p-value corresponding to coefficient is zero. It indicates that there is sufficient evidence that the slope is non-zero. The value of R-square is 0.507 indicate that the relationship is moderate.
c)
To explain whether she can accurately judge a student’s performance without giving the midterms.
c)
Answer to Problem 38E
Not very accurate.
Explanation of Solution
Given:

The value of R-square is 0.507 indicate that the relationship is moderate. Also, standard error of the estimate se = 18.3043 which is very large. Hence, the predictions are not very accurate.
Chapter 27 Solutions
Stats: Modeling the World Nasta Edition Grades 9-12
Additional Math Textbook Solutions
Elementary Statistics: Picturing the World (6th Edition)
Introductory Statistics
Introductory Statistics


 MATLAB: An Introduction with ApplicationsStatisticsISBN:9781119256830Author:Amos GilatPublisher:John Wiley & Sons Inc
 Probability and Statistics for Engineering and th...StatisticsISBN:9781305251809Author:Jay L. DevorePublisher:Cengage Learning
 Statistics for The Behavioral Sciences (MindTap C...StatisticsISBN:9781305504912Author:Frederick J Gravetter, Larry B. WallnauPublisher:Cengage Learning
 Elementary Statistics: Picturing the World (7th E...StatisticsISBN:9780134683416Author:Ron Larson, Betsy FarberPublisher:PEARSON
 The Basic Practice of StatisticsStatisticsISBN:9781319042578Author:David S. Moore, William I. Notz, Michael A. FlignerPublisher:W. H. Freeman
 Introduction to the Practice of StatisticsStatisticsISBN:9781319013387Author:David S. Moore, George P. McCabe, Bruce A. CraigPublisher:W. H. Freeman