
Concept explainers
Videos
a)
To write the equation of the regression line.
a)
Answer to Problem 37E
Explanation of Solution
Given:
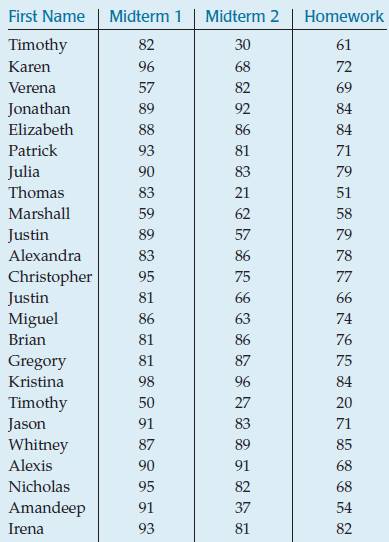
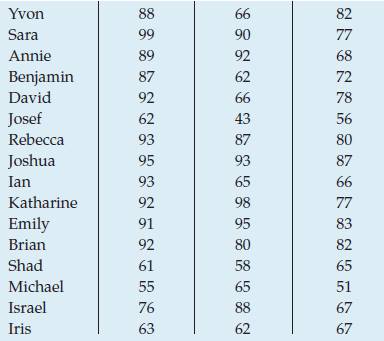
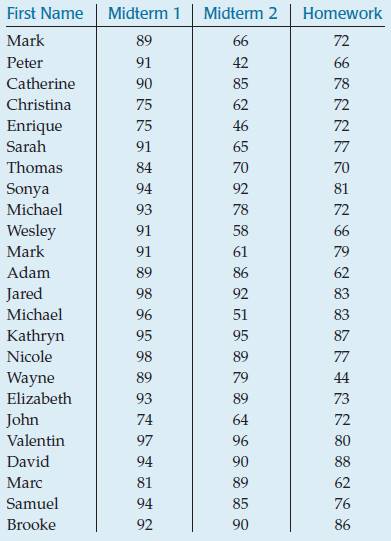
Using excel,
The general regression equation is,
Here,
Therefore, the equation of regression line is,
b)
To comment on the model.
b)
Explanation of Solution
Given:

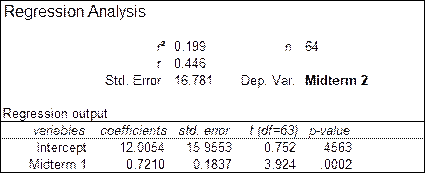
The equation of regression line is,
The
c)
To explain whether the model is well predictable from p-value.
c)
Explanation of Solution
Given:

The equation of regression line is,
The p-value of the slope is 0.002 which indicates that there is sufficient evidence that the slope is non-zero. But the value of R-square is 0.199 indicate that the relationship is weak. Therefore, overall relationship between midterm 1 and midterm 2 is weaker. Hence, it indicates that the prediction of midterm 2 will not accurate.
Chapter 27 Solutions
Stats: Modeling the World Nasta Edition Grades 9-12
Additional Math Textbook Solutions
Introductory Statistics (2nd Edition)
Statistics for Business and Economics (13th Edition)
Elementary Statistics: Picturing the World (7th Edition)
Statistics for Psychology
Essentials of Statistics, Books a la Carte Edition (5th Edition)


 MATLAB: An Introduction with ApplicationsStatisticsISBN:9781119256830Author:Amos GilatPublisher:John Wiley & Sons Inc
 Probability and Statistics for Engineering and th...StatisticsISBN:9781305251809Author:Jay L. DevorePublisher:Cengage Learning
 Statistics for The Behavioral Sciences (MindTap C...StatisticsISBN:9781305504912Author:Frederick J Gravetter, Larry B. WallnauPublisher:Cengage Learning
 Elementary Statistics: Picturing the World (7th E...StatisticsISBN:9780134683416Author:Ron Larson, Betsy FarberPublisher:PEARSON
 The Basic Practice of StatisticsStatisticsISBN:9781319042578Author:David S. Moore, William I. Notz, Michael A. FlignerPublisher:W. H. Freeman
 Introduction to the Practice of StatisticsStatisticsISBN:9781319013387Author:David S. Moore, George P. McCabe, Bruce A. CraigPublisher:W. H. Freeman