
Concept explainers
Videos
a)
To explain the about the regression.
a)
Explanation of Solution
Given:


The regression equation is,
Therefore, intercept can be interpreted as the Budget will be -31.3869 million dollars when Runtime is 0 minutes. The slope says that the budget increases by 0.714400 million dollars or $714400 per minute run time.
b)
To discuss about the intercept by taking a note of p-value.
b)
Explanation of Solution
Given:


The regression equation is,
Therefore, intercept can be interpreted as the Budget will be -31.3869 million dollars when Runtime of movie is 0 minutes. This does not make sense as the budget would be 0 if the run time of movie is 0. As per p-value, the intercept is not significantly different from 0 which makes practically correct.
c)
To explain the standard deviation of the residual.
c)
Explanation of Solution
Given:
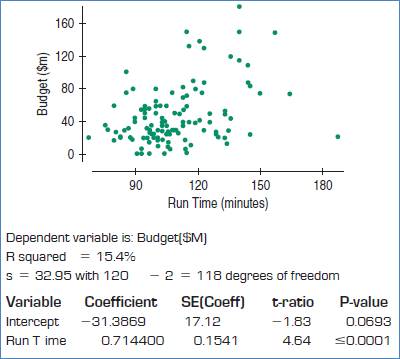

s = 32.95 is the standard deviation of the residuals.
Therefore, the actual values vary on average by 32.95 million dollars about the predicted values.
d)
To identify the values of the standard error of the slope of the regression line.
d)
Answer to Problem 3E
SEb = 0.1541
Explanation of Solution
Given:


The standard error of the slope of the regression line is,
SEb = 0.1541 million dollars per minute of run time.
e)
To explain the value of the standard error of the slope of the regression line.
e)
Explanation of Solution
Given:

The standard error of the slope of the regression line is,
SEb = 0.1541 million dollars per minute of run time.
This means that the slope of the regression line of different samples is expected to vary on average by 0.1541 million dollars per minute of run time.
Chapter 27 Solutions
Stats: Modeling the World Nasta Edition Grades 9-12
Additional Math Textbook Solutions
Elementary Statistics: Picturing the World (6th Edition)
Intro Stats, Books a la Carte Edition (5th Edition)
Elementary Statistics
Statistics for Business and Economics (13th Edition)
Elementary Statistics: Picturing the World (7th Edition)


 MATLAB: An Introduction with ApplicationsStatisticsISBN:9781119256830Author:Amos GilatPublisher:John Wiley & Sons Inc
 Probability and Statistics for Engineering and th...StatisticsISBN:9781305251809Author:Jay L. DevorePublisher:Cengage Learning
 Statistics for The Behavioral Sciences (MindTap C...StatisticsISBN:9781305504912Author:Frederick J Gravetter, Larry B. WallnauPublisher:Cengage Learning
 Elementary Statistics: Picturing the World (7th E...StatisticsISBN:9780134683416Author:Ron Larson, Betsy FarberPublisher:PEARSON
 The Basic Practice of StatisticsStatisticsISBN:9781319042578Author:David S. Moore, William I. Notz, Michael A. FlignerPublisher:W. H. Freeman
 Introduction to the Practice of StatisticsStatisticsISBN:9781319013387Author:David S. Moore, George P. McCabe, Bruce A. CraigPublisher:W. H. Freeman