
Concept explainers
Videos
a)
To state the variables and hypotheses about the slope.
a)
Answer to Problem 40E
Explanation of Solution
Given:


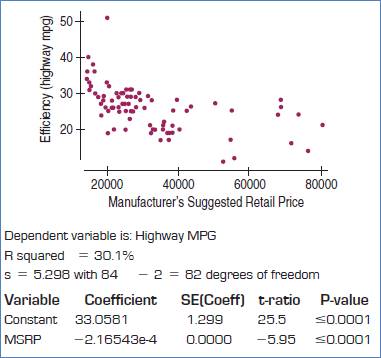
From the output, we want to know if there is an association between Retail price and MPG.
The variables are Retail price and MPG.
The null and alternative hypotheses:
That means,
b)
To check the assumptions and conditions for inference.
b)
Explanation of Solution
Given:

The conditions are: straight enough, Independence, Randomization, Random residual, Does plot thicken? and Nearly normal condition.
We will check it one by one.
Straight enough condition: Satisfied, because no curvature is present in the scatterplot.
Independence assumption: Satisfied, because the 84 cars are less than 10% of the population of all cars.
Randomization condition: Satisfied, assuming that the cars were randomly selected.
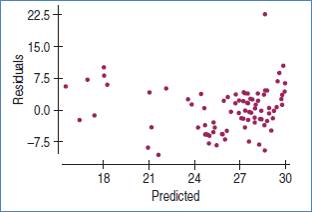
Random residuals condition: Satisfied, because there is no obvious pattern in the residual plot.
Does the plot thicken? condition: Satisfied, because the vertical spread in the residual plot is not increasing or decreasing.
Nearly normal condition: Satisfied, assuming that the residuals are roughly
c)
To perform the hypothesis test.
c)
Answer to Problem 40E
Standard error of slope is 0 so test not possible for this analysis.
Explanation of Solution
Given:

Formula:
Test statistic:
Standard error of slope is 0 so test not possible for this analysis.
Chapter 27 Solutions
Stats: Modeling the World Nasta Edition Grades 9-12
Additional Math Textbook Solutions
Elementary Statistics: Picturing the World (6th Edition)
Statistics for Psychology
Introductory Statistics
Statistics: The Art and Science of Learning from Data (4th Edition)
Fundamentals of Statistics (5th Edition)
Basic Business Statistics, Student Value Edition (13th Edition)


 MATLAB: An Introduction with ApplicationsStatisticsISBN:9781119256830Author:Amos GilatPublisher:John Wiley & Sons Inc
 Probability and Statistics for Engineering and th...StatisticsISBN:9781305251809Author:Jay L. DevorePublisher:Cengage Learning
 Statistics for The Behavioral Sciences (MindTap C...StatisticsISBN:9781305504912Author:Frederick J Gravetter, Larry B. WallnauPublisher:Cengage Learning
 Elementary Statistics: Picturing the World (7th E...StatisticsISBN:9780134683416Author:Ron Larson, Betsy FarberPublisher:PEARSON
 The Basic Practice of StatisticsStatisticsISBN:9781319042578Author:David S. Moore, William I. Notz, Michael A. FlignerPublisher:W. H. Freeman
 Introduction to the Practice of StatisticsStatisticsISBN:9781319013387Author:David S. Moore, George P. McCabe, Bruce A. CraigPublisher:W. H. Freeman