
Videos
a)
To find how many batteries were tested.
a)
Answer to Problem 33E
The number of batteries tested = 33.
Explanation of Solution
Given:
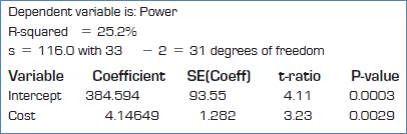

The number of batteries tested = 33.
b)
To explain whether the conditions for inference are satisfied.
b)
Answer to Problem 33E
All conditions are satisfied.
Explanation of Solution
Given:


The conditions are: straight enough, Independence, Randomization, Random residual, Does plot thicken? and Nearly normal condition.
We will check it one by one.
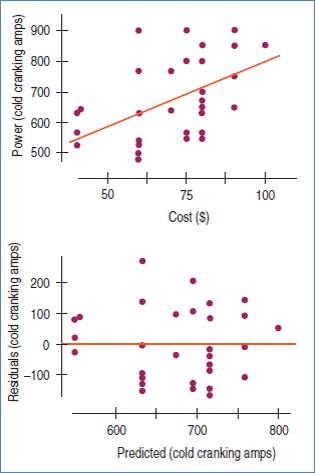
Straight enough condition: Satisfied, because no curvature is present in the
Independence assumption: Satisfied, because the 33 cars are less than 10% of the population of all cars.
Randomization condition: Satisfied, assuming that the sample is representative for the population.
Random residuals condition: Satisfied, because there is no obvious pattern in the residual plot.
Does the plot thicken? condition: Satisfied, because the vertical spread in the residual plot is not increasing or decreasing.
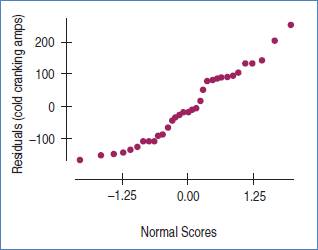
Nearly normal condition: Satisfied, because the normal quantile plot of the residual is roughly linear.
c)
To test an appropriate hypothesis.
c)
Answer to Problem 33E
There is sufficient evidence that the slope is non zero and provide evidence that the more expensive batteries do have more cranking amps.
Explanation of Solution
Given:


Formula:
Test statistic:
The null and alternative hypotheses:
Test statistic:
The degrees of freedom = df = 31
Therefore, p-value would be,
P-value = 0.00146 …Using excel formula, =TDIST(3.23,31,1)
Decision: P-value < 0.05, reject H0.
Conclusion: There is sufficient evidence that the slope is non zero and provide evidence that the more expensive batteries do have more cranking amps.
d)
To explain whether the association is strong.
d)
Answer to Problem 33E
No.
Explanation of Solution
Given:


The R-square value is 25.2% which is very low and s = 116. Therefore, there is no strong relationship.
e)
To write the equation of the regression line.
e)
Answer to Problem 33E
Explanation of Solution
Given:

The general regression equation is,
Here,
Therefore, the equation of regression line is,
f)
To find the 90% confidence interval for slope.
f)
Answer to Problem 33E
The 90% confidence interval for slope is,
Explanation of Solution
Given:

Formula:
Confidence interval for slope is,
First, need to find critical value
Critical value for df = 31 and confidence level = 0.90 is,
Therefore, the 90% confidence interval for slope is,
g)
To interpret the 90% confidence interval for slope.
g)
Answer to Problem 33E
We are 90% confident that Cranking amps increases on average between 1.97 and 6.32 per dollar of battery cost increases.
Explanation of Solution
Given:

The 90% confidence interval for slope is,
We are 90% confident that Cranking amps increases on average between 1.97 and 6.32 per dollar of battery cost increases.
Chapter 27 Solutions
Stats: Modeling the World Nasta Edition Grades 9-12
Additional Math Textbook Solutions
Introductory Statistics
Elementary Statistics (13th Edition)
Statistical Reasoning for Everyday Life (5th Edition)


 MATLAB: An Introduction with ApplicationsStatisticsISBN:9781119256830Author:Amos GilatPublisher:John Wiley & Sons Inc
 Probability and Statistics for Engineering and th...StatisticsISBN:9781305251809Author:Jay L. DevorePublisher:Cengage Learning
 Statistics for The Behavioral Sciences (MindTap C...StatisticsISBN:9781305504912Author:Frederick J Gravetter, Larry B. WallnauPublisher:Cengage Learning
 Elementary Statistics: Picturing the World (7th E...StatisticsISBN:9780134683416Author:Ron Larson, Betsy FarberPublisher:PEARSON
 The Basic Practice of StatisticsStatisticsISBN:9781319042578Author:David S. Moore, William I. Notz, Michael A. FlignerPublisher:W. H. Freeman
 Introduction to the Practice of StatisticsStatisticsISBN:9781319013387Author:David S. Moore, George P. McCabe, Bruce A. CraigPublisher:W. H. Freeman