
Videos
a)
To check the assumptions and conditions for inference.
a)
Answer to Problem 41E
All conditions satisfied.
Explanation of Solution
Given:

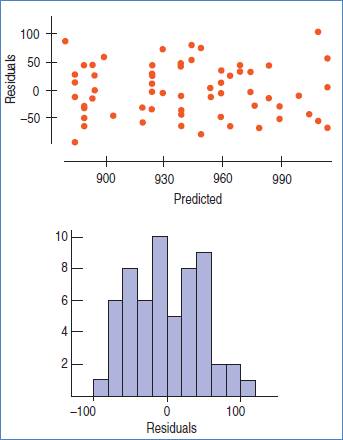
The conditions are: straight enough, Independence, Randomization, Random residual, Does plot thicken? and Nearly normal condition.
We will check it one by one.
Straight enough condition: Satisfied, because no curvature is present in the scatterplot.
Independence assumption: Satisfied, because the 58 are less than 10% of the population of all cities.
Randomization condition: Satisfied, as cities were randomly selected.
Random residuals condition: Satisfied, because there is no obvious pattern in the residual plot.
Does the plot thicken? condition: Satisfied, because the vertical spread in the residual plot is not increasing or decreasing.
Nearly normal condition: Satisfied, because the histogram of the residual is roughly symmetric and unimodal.
b)
To perform the hypothesis test.
b)
Answer to Problem 41E
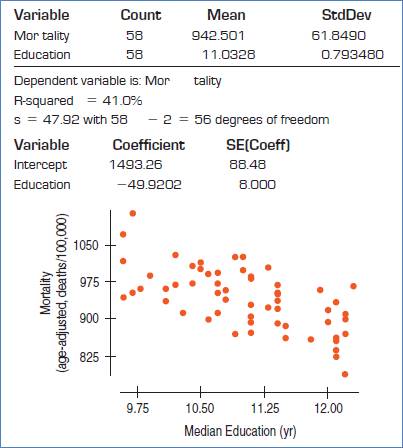
There is sufficient evidence that the slope is non zero and there is association between mortality rate and education level.
Explanation of Solution
Given:

Formula:
Test statistic:
The null and alternative hypotheses:
Test statistic:
The degrees of freedom = df = 56
Therefore, p-value would be,
P-value = 0.0000 …Using excel formula, =TDIST(6.24,56,2)
Decision: P-value < 0.05, reject H0.
Conclusion: There is sufficient evidence that the slope is non zero and there is association between mortality rate and education level.
c)
To explain whether to conclude that getting more education is likely to prolong your life.
c)
Answer to Problem 41E
No.
Explanation of Solution
Given:
The data are on cities, not individuals. Also, these are observational data. Therefore, we can not predict causal consequences from them.
d)
To find the 95% confidence interval for the slope of the regression line.
d)
Answer to Problem 41E
We are 95% confident that the slope of the population of regression line is between -65.9442 and -33.8962.
Explanation of Solution
Given:

Formula:
Confidence interval for slope is,
The confidence level = 0.95
So, level of significance =
First need to find critical t value.
tc = 2.003 …Using excel formula, =TINV(0.05,56)
Using formula, 95% confidence interval for the slope of the regression line.
Therefore, we are 95% confident that the slope of the population of regression line is between -65.9442 and -33.8962.
e)
To explain the 95% confidence interval for the slope of the regression line.
e)
Answer to Problem 41E
The mortality decreases on average between 33.8946 and 65.9442 deaths per 100,000 for each extra year of average Education.
Explanation of Solution
Given:

Therefore, we are 95% confident that the slope of the population of regression line is between -65.9442 and -33.8962.
The mortality decreases on average between 33.8946 and 65.9442 deaths per 100,000 for each extra year of average Education.
f)
To find the 95% confidence interval for the average Mortality rate in cities where the adult population completed an average of 12 years of school.
f)
Answer to Problem 41E
We are 95% confidence that the average Mortality for cities with an average of 12 years of Education will be between 874.23 and 914.19 deaths per 100,000 people.
Explanation of Solution
Given:

Formula:
Confidence interval for average of response variable is,
Standard error is,
Therefore, predicted value becomes,
So, standard error is,
The confidence level = 0.95
So, level of significance =
First need to find critical t value.
tc = 2.003 …Using excel formula, =TINV(0.05,56)
Using formula, 95% confidence interval is,
Hence, we are 95% confidence that the average Mortality for cities with an average of 12 years of Education will be between 874.23 and 914.19 deaths per 100,000 people.
Chapter 27 Solutions
Stats: Modeling the World Nasta Edition Grades 9-12
Additional Math Textbook Solutions
Elementary Statistics: Picturing the World (7th Edition)
Basic Business Statistics, Student Value Edition (13th Edition)
Statistical Reasoning for Everyday Life (5th Edition)
Essentials of Statistics (6th Edition)
Introductory Statistics
Statistics: The Art and Science of Learning from Data (4th Edition)


 MATLAB: An Introduction with ApplicationsStatisticsISBN:9781119256830Author:Amos GilatPublisher:John Wiley & Sons Inc
 Probability and Statistics for Engineering and th...StatisticsISBN:9781305251809Author:Jay L. DevorePublisher:Cengage Learning
 Statistics for The Behavioral Sciences (MindTap C...StatisticsISBN:9781305504912Author:Frederick J Gravetter, Larry B. WallnauPublisher:Cengage Learning
 Elementary Statistics: Picturing the World (7th E...StatisticsISBN:9780134683416Author:Ron Larson, Betsy FarberPublisher:PEARSON
 The Basic Practice of StatisticsStatisticsISBN:9781319042578Author:David S. Moore, William I. Notz, Michael A. FlignerPublisher:W. H. Freeman
 Introduction to the Practice of StatisticsStatisticsISBN:9781319013387Author:David S. Moore, George P. McCabe, Bruce A. CraigPublisher:W. H. Freeman