Concept explainers
To review:
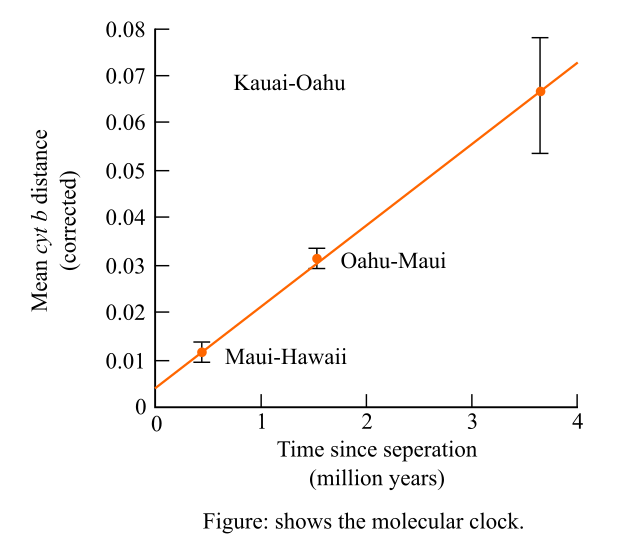
The molecular divergence of a mitochondrial DNA (deoxyribonucleic acid) gene among the sister species of birds and study the graph given in order to calculate the average rate of change in cyt b.
Given:
It is given that, the researchers have examined in their studies that there was a molecular divergence in the mitochondrial DNA gene in the species of the honeycreepers on the Hawaiian Islands. Then the graph was plotted to measure the molecular divergence against the estimated dates of the separation of the islands. The molecular clock is shown below:

Introduction:
Molecular clock is an essential tool in biology and its streams. It is the hypothesis which states that the how the DNA and protein have evolved due to molecular divergence. It also states that at which rate it has been constant over the time and in different organisms.
Want to see the full answer?
Check out a sample textbook solution
Chapter 21 Solutions
Life: The Science of Biology
- Species A, B, and C are related according to the phylogeny below (A,(B,C)). Species A and C diverged 10,000,000 generations ago, and species B and C diverged 100,000 generations ago. All three species are diploids. The mutation rate in their genomes is 1×10⁻⁹ mutations per basepair per generation. A gene found in all three species is 1,000 bp long. 75% of mutations in the gene are deleterious and 0% are beneficial. Use this information to answer the following questions. a) Species A has 100,000 diploid individuals. How many new mutations arise per basepair per generation in species A? b) What is the gene’s neutral mutation rate per basepair per generation? c) What is the expected rate of fixation of neutral mutations in the gene? d) How many neutral substitution do you expect to observe if you compared the gene between species A and C?arrow_forwardSpecies A, B, and C are related according to the phylogeny below (A,(B,C)). Species A and C diverged 10,000,000 generations ago, and species B and C diverged 100,000 generations ago. All three species are diploids. The mutation rate in their genomes is 1×10⁻⁹ mutations per basepair per generation. A gene found in all three species is 1,000 bp long. 75% of mutations in the gene are deleterious and 0% are beneficial. Use this information to answer the following questions. a) If there are 20 polymorphic synonymous sites in the gene in species A, how many non-synonymous sites do you expect to be polymorphic? Assume all synonymous changes are neutral. b) In species B, there are an average of two pairwise differences between individuals within the gene. What is the effective population size of species B? c) What do you expect FST to be between species B and C? Assume no migration between the species after they diverged.arrow_forwardCHARACTERS 1 2 3 4 5 SPECIES A 0 0 1 0 0 B 1 0 1 0 1 C 1 0 1 1 0 D 1 1 1 0 1 Use the cladistic approach (using parsimony) to draw the tree that derives from the same data matrix above. Map both the species and the traits to your tree.arrow_forward
- The second step to calculate the evolutionary rate is based on the values of p obtained above. The relationship between the evolutionary rate, 1 (i.e., changes in sequence per number of years), the proportion of different sites, p, and divergence time in years between the two species, t, is approximately: 21t=p 6. We are assuming that the average value of l applies to all lineages and that each pair of species shares a common ancestor. Given that, why does the formula have a factor of 2 on the left hand side? Hint: think about what happens at a divergence.arrow_forwardGive typing answer with explanation and conclusionarrow_forwardIn the example below, the letters represent amino acids that make up a polypeptide found in all the vertebrates listed. Use the steps outlined above to construct a cladogram from the different amino acid sequences given. Assume that the sequences are already aligned and begin with comparing the number of differences between species.arrow_forward
- According to the data, which two species in Table 3 are most closely related? Why do we think these two lineages diverged the shortest time ago? Which species is most closely related to humans? Which is most distantly related to humans To humans, alligators and crocodiles look very similar. However, which species difference in Table 3 comes closest to the difference between alligators and crocodiles? How can we explain this?arrow_forwardPlease answer fast Use the same diagram to determine whether each statement is true or false.arrow_forwardPlease asaparrow_forward
 Biology: The Dynamic Science (MindTap Course List)BiologyISBN:9781305389892Author:Peter J. Russell, Paul E. Hertz, Beverly McMillanPublisher:Cengage Learning
