
Concept explainers
Videos
The stress-strain curve.
Explanation of Solution
Given:
The initial area is
The final area is
The original length is
Formula used:
The true strain is given as,
Here,
The Actual area is given as,
The actual are for the initial load is given as,
The final length is given as,
Here,
The stress is given as,
Here, P is the applied load.
Calculation:
For
The final length can be calculated as,
The strain can be calculated as,
The actual area can be calculated as,
The stress can be calculated as,
For
The final length can be calculated as,
The strain can be calculated as,
The actual area can be calculated as,
The stress can be calculated as,
For
The final length can be calculated as,
The strain can be calculated as,
The actual area can be calculated as,
The stress can be calculated as,
For
The final length can be calculated as,
The strain can be calculated as,
The actual area can be calculated as,
The stress can be calculated as,\
For
The final length can be calculated as,
The strain can be calculated as,
The actual area can be calculated as,
The stress can be calculated as,
For
The final length can be calculated as,
The strain can be calculated as,
The actual area can be calculated as,
The stress can be calculated as,
For
The final length can be calculated as,
The strain can be calculated as,
The actual area can be calculated as,
The stress can be calculated as,
For
The final length can be calculated as,
The strain can be calculated as,
The actual area can be calculated as,
The stress can be calculated as,
The stress-strain curve from the above calculation is given as,
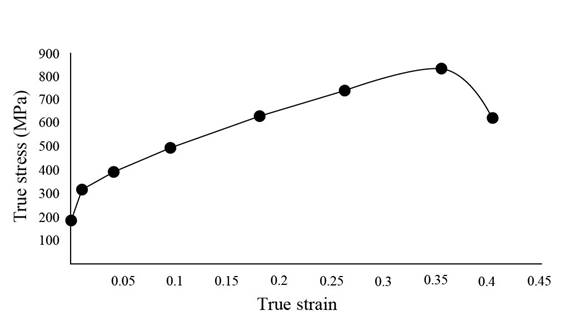
Figure 1.1
Want to see more full solutions like this?
Chapter 2 Solutions
EBK MANUFACTURING PROCESSES FOR ENGINEE


- The following data are obtained from a tensile test of a copper specimen. - The load at the yield point is 143 kN. - Length of the specimen is 29 mm. - The yield strength is 71 kN/mm2. - The percentage of elongation is 48 %. Determine the following Diameter of the specimen, Final length of the specimen, Stress under an elastic load of 18 kN, Young's Modulus if the elongation is 1 mm at 18 kN and Final diameter if the percentage of reduction in area is 29 %. Initial Cross-sectional Area 2.01 mm2. The Diameter of the Specimen 1.59 mm. Final Length of the Specimen 42.92 mm. Stress at the elastic load 8955.22 N/mm2. Find: Young's Modulus of the Specimen (in N/mm2) Final Area of the Specimen at Fracture (in mm) Final Diameter of the Specimen after Fracture (in mm)arrow_forwardThe following data are obtained from a tensile test of a copper specimen. - The load at the yield point is 143 kN. - Length of the specimen is 29 mm. - The yield strength is 71 kN/mm2. - The percentage of elongation is 48 %. Determine the following Diameter of the specimen, Final length of the specimen, Stress under an elastic load of 18 kN, Young's Modulus if the elongation is 1 mm at 18 kN and Final diameter if the percentage of reduction in area is 29 %. FIND: Young's Modulus of the Specimen (in N/mm2) Final Area of the Specimen at Fracture (in mm) Final Diameter of the Specimen after Fracture (in mm)arrow_forwardThe following stress-strain curve was prepared based on a tensile test of a specimen that had a circular cross-section. The gage diameter of the specimen was 0.25 inches and the gage length was 4 inches. The stress scale of the stress-strain diagram is given with the factor a = 10 ksi. Estimate: (a) The modulus of elasticity. (b) The ultimate strength. (c) The yield strength (0.2% offset). (d) The percent elongation at fracture. 2013 Michael Swanbom STRESS VS. STRAIN BY NC SA 7a bat Sat 2at at 0.05 STRAIN 0.01 0.04 0.06 0.08 0.02 0.03 0.07 0.09 STRESSarrow_forward
- A tension test was performed on a specimen having an original diameter of 12.5 mm and a gage length of 50mm. The data are listed in the table below: Complete the following: Plot the stress-strain curve. Label the y-axis every 50 MPa, and the x-axis every 0.05 mm/mm. Plot the linear portion of the stress-strain curve (first 5 points). Label the y-axis every 50 MPa, and the x-axis every 0.001 mm/mm. Determine the approximate Modulus of Elasticity Determine the approximate Ultimate Stress Determine the approximate Fracture Stress Determine the approximate Modulus of Resilience Determine the approximate Modulus of Toughness Other Requirements: Provide an example hand-written calculation showing how you calculated one point on the curve. Remember to properly label your plots and provide axis labels with units. Hand sketched plots will not be accepted. Use Excel or similar software.arrow_forwardForce P and length change AL data are given in table below for the initial portion of a tension test on 7075-T651 Al alloy. The diameter before testing was 9.07 mm., and the gage length Linitial for t length change measurement was 50.8 mm. Calculate corresponding values of engineering stress and strain, and display these values on a stress-strain plot. (use the region for drawing your plot in question sheet) P, kN AL mm 7.22 0.0839 14.34 0.1636 21.06 0.241 0.308 0.380 0.484 0.614 0.924 26.8 31.7 34.1 35.0 36.0 36.5 1.279 36.9 37.2 1.622 1.994arrow_forwardQ2/ Aluminum tensile specimen with 12.5mm diameter, a gauge length of 50.8mm and the final diameter was 10.5mm. • Plot the engineering stress-strain curve and the true stress- strain curve. Determine proportion limit, young's modulus, the yield point, the ultimate tensile strength, the failure stress on drawing? • Determine Ductility? • Determine Resilience modulus and toughness modulus? 0.006 0.008 0.012 0.017 Strain mm/mm Apparent Stress N/mm 100 0.004 0.22 0.25 0.27 150 200 290 325 480 450 410 True stress N/mm 100.1 150.3 201 326 400 500 550 620arrow_forward
- (a) Two different materials designated A, and B, are tested in tension using test specimens having diameters of 0.505 cm and gage lengths of 2.0 cm (Figure 1). At failure, the distances between the gauge length marks are 2.13 cm (sample A) and 2.48 cm (sample B). Also, at the failure cross-sections, the diameters are found to be 0.484 cm (sample A) and 0.398 cm (sample B), respectively. Classify each material as brittle or ductile using your judgement.arrow_forward(a) Two different materials designated A, and B, are tested in tension using test specimens having diameters of 0.505 cm and gage lengths of 2.0 cm (Figure 1). At failure, the distances between the gauge length marks are 2.13 cm (sample A) and 2.48 cm (sample B). Also, at the failure cross-sections, the diameters are found to be 0.484 cm (sample A) and 0.398 cm (sample B), respectively. i. Calculate the percent elongation and percent of area reduction in each specimen. a. Sample A b. Sample Barrow_forwardThe following data (in given figure) were obtained from the tensile test of Aluminum alloy. The initial diameter of test specimen was 0.505 inch and gauge length was 2.0 inch. Plot the stress strain diagram and determine(a) Proportional Limit (b) Modulus of Elasticity (c) Yield Stress at 0.2% offset (d) Ultimate Stress and(e) Nominal Rupture Stress.arrow_forward
- The problem: A 13 mm-diameter tensile specimen has a 50 mm gauge length. The load corresponding to the 0.2 percent offset is 6800 kg and the maximum load is 8400 kg. Fracture occurs at 7300 kg. The diameter after fracture is 8 mm and the gauge length at fracture is 65 mm. a) Calculate the standard mechanical properties of the used specimen in the tension test, first determine the standard properties and then calculated them? This includes computation each of Yield strength. Ultimate tensile strength. Fracture stress. Ductility (percent of elongation and reduction in cross section area). b) IfE- 207 GPa, estimate the elastic recoverable strain at maximum load? ) By using the same conditions of the above test, Discussion the possibility to replace the metallic sample with ceramic sample?arrow_forwardBronze alloy, the following true stresses produce the corresponding plastic true strains, before to necking: On the basis of this information, compute the true stress necessary to produce a true strain of 0.25 and then find the engineering stress and strain at this point. True stresses (MPa) True strain 354 0121 70 018arrow_forwardThe following data are obtained from a tensile test of a copper specimen. - The load at the yield point is 158 kN. - Length of the specimen is 26 mm. - The yield strength is 75 kN/mm?. - The percentage of elongation is 40 %. Determine the following (v) Final diameter if the percentage of reduction in area is 21 %. Final Area of the Specimen at Fracture (in mm) Final Diameter of the Specimen after Fracture (in mm)arrow_forward
 Elements Of ElectromagneticsMechanical EngineeringISBN:9780190698614Author:Sadiku, Matthew N. O.Publisher:Oxford University Press
 Mechanics of Materials (10th Edition)Mechanical EngineeringISBN:9780134319650Author:Russell C. HibbelerPublisher:PEARSON
 Thermodynamics: An Engineering ApproachMechanical EngineeringISBN:9781259822674Author:Yunus A. Cengel Dr., Michael A. BolesPublisher:McGraw-Hill Education
 Control Systems EngineeringMechanical EngineeringISBN:9781118170519Author:Norman S. NisePublisher:WILEY
 Mechanics of Materials (MindTap Course List)Mechanical EngineeringISBN:9781337093347Author:Barry J. Goodno, James M. GerePublisher:Cengage Learning
 Engineering Mechanics: StaticsMechanical EngineeringISBN:9781118807330Author:James L. Meriam, L. G. Kraige, J. N. BoltonPublisher:WILEY