
Introductory Statistics (10th Edition)
10th Edition
ISBN: 9780321989178
Author: Neil A. Weiss
Publisher: PEARSON
expand_more
expand_more
format_list_bulleted
Videos
Textbook Question
Chapter 15.2, Problem 63E
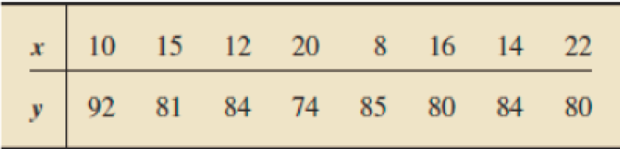
In Exercises 15.58–15.63, we repeat the information from Exercises 15.22–15.27. Presuming that the assumptions for regression inferences are met, decide at the specified significance level whether the data provide sufficient evidence to conclude that the predictor variable is useful for predicting the response variable.
15.63 Study Time and Score. Following are the data on total hours studied over 2 weeks and test score at the end of the 2 weeks from Exercise 15.27. Use α =0.01.
Expert Solution & Answer
Want to see the full answer?
Check out a sample textbook solution
Students have asked these similar questions
a) Determine sum of squares of error (SSE) and correlation coefficient (R?) for the model.
b) Estimate the parameters of reaction model with 95% confidence limits.
c) Evaluate the fit of the model equation you obtained to your data.
d) Estimate concentration of flavor compound after 17 days of storage by using the best model.
Time
Concentration
(d)
(mg/L)
561.00
569.67
3.
252.11
258.40
7.
107.95
7.
113.22
10
47.77
10
50.83
15
23.80
15
22.95
23
9.35
23
10.20
Explain whether each scenario below is a regression, classification, or unsupervised learn-
ing problem. If it is a supervised learning scenario, indicate whether we are more interested
in inference or prediction. Finally, provide in each case the number of observations, n,
and the number of predictors, p.
(1) An online retailer must decide whether to display advertisement A or advertisement
B to each customer on the basis of collected customer demographics (age, income,
zip code, and gender). A set of 150 of its customers have already expressed a
preference for one advertisement or the other.
(2) A policy analyst is interested in discovering factors that are associated with the
crime rate across different U.S. cities. For each of 500 cities, the policy analyst
gathers the following data: the crime rate, unemployment rate, population, median
income, median home price, and state.
(3) The
the channel owner to see where the subscribers are located, their age and gender, the
times and days…
a) Give the estimated regression function. Also, give the hypothesis, test statistic and the rejection region to assess whether the interactive terms contribute to reducing the mean variation of the response variable. Test at ? = 0.05. Then How can the conclusion be confirmed? Explain the result.
Chapter 15 Solutions
Introductory Statistics (10th Edition)
Ch. 15.1 - Suppose that x and y are predictor and response...Ch. 15.1 - Prob. 2ECh. 15.1 - Prob. 3ECh. 15.1 - Prob. 4ECh. 15.1 - Prob. 5ECh. 15.1 - In Exercises 15.315.6, assume that the variables...Ch. 15.1 - The difference between an observed value and a...Ch. 15.1 - Identify two graphs used in a residual analysis to...Ch. 15.1 - Which graph used in a residual analysis provides...Ch. 15.1 - Figure 15.8 shows three residual plots and a...
Ch. 15.1 - Figure 15.9 on the next page shows three residual...Ch. 15.1 - In Exercises 15.1215.21, we repeat the data and...Ch. 15.1 - In Exercises 15.1215.21, we repeat the data and...Ch. 15.1 - Prob. 14ECh. 15.1 - Prob. 15ECh. 15.1 - Prob. 16ECh. 15.1 - Prob. 17ECh. 15.1 - Prob. 18ECh. 15.1 - Prob. 19ECh. 15.1 - Prob. 20ECh. 15.1 - Prob. 21ECh. 15.1 - Prob. 22ECh. 15.1 - Prob. 23ECh. 15.1 - Prob. 24ECh. 15.1 - Prob. 25ECh. 15.1 - In Exercises 15.2215.27, we repeat the information...Ch. 15.1 - Prob. 27ECh. 15.1 - Prob. 28ECh. 15.1 - In Exercises 15.2815.33, a. compute the standard...Ch. 15.1 - Prob. 30ECh. 15.1 - In Exercises 15.2815.33, a. compute the standard...Ch. 15.1 - In Exercises 15.2815.33, a. compute the standard...Ch. 15.1 - In Exercises 15.2815.33, a. compute the standard...Ch. 15.1 - In Exercises 15.3415.43, use the technology of...Ch. 15.1 - In Exercises 15.3415.43, use the technology of...Ch. 15.1 - In Exercises 15.3415.43, use the technology of...Ch. 15.1 - In Exercises 15.3415.43, use the technology of...Ch. 15.1 - Prob. 38ECh. 15.1 - Prob. 39ECh. 15.1 - Prob. 40ECh. 15.1 - Prob. 41ECh. 15.1 - Prob. 42ECh. 15.1 - Prob. 43ECh. 15.2 - Explain why the predictor variable is useless as a...Ch. 15.2 - Prob. 45ECh. 15.2 - Prob. 46ECh. 15.2 - In this section, we used the statistic b1 as a...Ch. 15.2 - In Exercises 15.4815.57, we repeat the information...Ch. 15.2 - Prob. 49ECh. 15.2 - In Exercises 15.4815.57, we repeat the information...Ch. 15.2 - In Exercises 15.4815.57, we repeat the information...Ch. 15.2 - Prob. 52ECh. 15.2 - Prob. 53ECh. 15.2 - Prob. 54ECh. 15.2 - In Exercises 15.4815.57, we repeat the information...Ch. 15.2 - Prob. 56ECh. 15.2 - Prob. 57ECh. 15.2 - Prob. 58ECh. 15.2 - In Exercises 15.5815.63, we repeat the information...Ch. 15.2 - Prob. 60ECh. 15.2 - In Exercises 15.5815.63, we repeat the information...Ch. 15.2 - Prob. 62ECh. 15.2 - In Exercises 15.5815.63, we repeat the information...Ch. 15.2 - Prob. 64ECh. 15.2 - In each of Exercises 15.6415.69, apply Procedure...Ch. 15.2 - In each of Exercises 15.6415.69, apply Procedure...Ch. 15.2 - Prob. 67ECh. 15.2 - Prob. 68ECh. 15.2 - Prob. 69ECh. 15.2 - Prob. 70ECh. 15.2 - In Exercises 15.7015.80, use the technology of...Ch. 15.2 - In Exercises 15.7015.80, use the technology of...Ch. 15.2 - Prob. 73ECh. 15.2 - Prob. 74ECh. 15.2 - Prob. 75ECh. 15.2 - In Exercises 15.7015.80, use the technology of...Ch. 15.2 - Prob. 77ECh. 15.2 - Prob. 78ECh. 15.2 - In Exercises 15.7015.80, use the technology of...Ch. 15.2 - Prob. 80ECh. 15.3 - Without doing any calculations, fill in the blank....Ch. 15.3 - Prob. 82ECh. 15.3 - Prob. 83ECh. 15.3 - Prob. 84ECh. 15.3 - In Exercises 15.8215.91, we repeat the data from...Ch. 15.3 - Prob. 86ECh. 15.3 - Prob. 87ECh. 15.3 - In Exercises 15.8215.91, we repeat the data from...Ch. 15.3 - Prob. 89ECh. 15.3 - Prob. 90ECh. 15.3 - Prob. 91ECh. 15.3 - Prob. 92ECh. 15.3 - In Exercises 15.9215.97, presume that the...Ch. 15.3 - In Exercises 15.9215.97, presume that the...Ch. 15.3 - In Exercises 15.9215.9, presume that the...Ch. 15.3 - Prob. 96ECh. 15.3 - In Exercises 15.9215.97, presume that the...Ch. 15.3 - Prob. 98ECh. 15.3 - In Exercises 15.9815.108, use the technology of...Ch. 15.3 - In Exercises 15.9815.108, use the technology of...Ch. 15.3 - In Exercises 15.9815.108, use the technology of...Ch. 15.3 - In Exercises 15.9815.108, use the technology of...Ch. 15.3 - Prob. 103ECh. 15.3 - Prob. 104ECh. 15.3 - Prob. 105ECh. 15.3 - Prob. 106ECh. 15.3 - In Exercises 15.9815.108, use the technology of...Ch. 15.3 - Prob. 108ECh. 15.3 - Margin of Error in Regression. In Exercises 15.109...Ch. 15.3 - Refer to the confidence interval and prediction...Ch. 15.4 - Identify the statistic used to estimate the...Ch. 15.4 - Prob. 112ECh. 15.4 - Suppose that, for a sample of pairs of...Ch. 15.4 - Prob. 114ECh. 15.4 - Prob. 115ECh. 15.4 - Prob. 116ECh. 15.4 - Prob. 117ECh. 15.4 - Prob. 118ECh. 15.4 - Prob. 119ECh. 15.4 - Prob. 120ECh. 15.4 - Prob. 121ECh. 15.4 - Prob. 122ECh. 15.4 - Prob. 123ECh. 15.4 - Prob. 124ECh. 15.4 - Prob. 125ECh. 15.4 - Prob. 126ECh. 15.4 - Prob. 127ECh. 15.4 - Prob. 128ECh. 15.4 - Prob. 129ECh. 15.4 - Prob. 130ECh. 15.4 - Prob. 131ECh. 15.4 - Prob. 132ECh. 15.4 - Prob. 133ECh. 15.4 - In each of Exercises 15.13415.144, use the...Ch. 15.4 - In each of Exercises 15.13415.144, use the...Ch. 15.4 - Prob. 136ECh. 15.4 - Prob. 137ECh. 15.4 - Prob. 138ECh. 15.4 - Prob. 139ECh. 15.4 - Prob. 140ECh. 15.4 - In each of Exercises 15.13415.144, use the...Ch. 15.4 - Prob. 142ECh. 15.4 - Prob. 143ECh. 15.4 - Prob. 144ECh. 15 - Prob. 1RPCh. 15 - Suppose that x and y are two variables of a...Ch. 15 - What two plots did we use in this chapter to...Ch. 15 - Regarding analysis of residuals, decide in each...Ch. 15 - Suppose that you perform a hypothesis test for the...Ch. 15 - Prob. 6RPCh. 15 - Prob. 7RPCh. 15 - Prob. 8RPCh. 15 - Prob. 9RPCh. 15 - Identify the relationship between two variables...Ch. 15 - Graduation Rates. Graduation ratethe percentage of...Ch. 15 - Prob. 12RPCh. 15 - Prob. 13RPCh. 15 - For Problems 1417, presume that the variables...Ch. 15 - For Problems 1417, presume that the variables...Ch. 15 - For Problems 1417, presume that the variables...Ch. 15 - Prob. 17RPCh. 15 - In Problems 1820, use the technology of your...Ch. 15 - In Problems 1820, use the technology of your...Ch. 15 - In Problems 1820, use the technology of your...Ch. 15 - Recall from Chapter 1 (see page 34) that the Focus...Ch. 15 - At the beginning of this chapter, we presented...
Knowledge Booster


Learn more about
Need a deep-dive on the concept behind this application? Look no further. Learn more about this topic, statistics and related others by exploring similar questions and additional content below.Similar questions
- Two measures of a baseball player's effectiveness as a hitter are the number of hits he makes in a season and thenumber of times he "bats in" a run (knows as "Runs Batted In" or RBIs). Can we predict a batter's RBIs from hisMajor League Baseball batters in 2017.hits? Below is numerical and graphical output from a computer regression of RBIs on Hits for 12 randomly selected Major League Baseball batters in 2017. Assume that the conditions for inference have been satisfied.(a) Do these data provide convincing evidence that there is a linear relationship between RBIs and Flits for MajorLeague Baseball batters in 2017? (b) Construct a 95% confidence interval for the slope of the population regression line for predicting RBIs from Hits.arrow_forwardExamining the below R output, explain what model was selected for forecasting?arrow_forwardPlease do not give solution in image format thanku Explain whether each scenario is a classification or regression problem, and indicate whether we are most interested in inference or prediction and why. Finally, provide n (number of observations) and p (number of predictors): 1. Season ticket holders (STH) are important for both collegiate and professional sports teams. Penn State’s football program wants to use quantity of tickets, section, percentage of tickets used throughout the year, and percentage of games attended to predict whether a STH is likely to renew their seats. They currently have 4,000 STHs.arrow_forward
- In Exercises, assume that the variables under consideration satisfy the assumptions for regression inferences. Based on a sample of data points, what is the best estimate of the population regression line?arrow_forwardDo a simple linear regression. Determine the descriptive statistics (the coefficients of the sample linear regression line – b0 and b1 – as well as r and r2. Please include the appropriate graphs, calculations, ANOVA table, tests of hypotheses, and interval estimates. Use a hypothetical state with 700 (million dollars) in claims to do the interval estimates. Please interpret the results.arrow_forward1) Match each of the five scatterplots to the appropriate correlation coefficient and equation of regression line. Explain how you know that you have made a correct match. a. r= 0.83, y= -2.1 + 1.4x d. r= -0.83, y = 11.8 – 1.4x b. r= -0.31, y = 7.8 – 0.5x e. r= 0.41, y=1.4 + 1.4x c. r= 0.96, y= -2.1 + 1.4x Scatterplot 1 Scatterplot 2 Scatterplot 3 Scatterplot 4 Scatterplot 5arrow_forward
- In Exercises 8–12, determine whether the statement is true or false. If the statement is false, rewrite it as a true statement. #10. In general, the slope of the least-squares regression line is equal to the correlation coefficient.arrow_forwardplease help Interpret this SPSS output based on, a) What is the coefficient of determination and interpret its value. Be elaborate and precise in your answer. Provide at least two sentences of explanation. b) How do you assess the overall significance of the regression? What is your conclusion in the context of this example? Be elaborate and precise in your answer. Provide at least three sentences of explanation. c) Interpret the value of the regression coefficient for the variable "Comfort". Be elaborate and precise in your answer. Provide at least three sentences of explanation.arrow_forward
arrow_back_ios
arrow_forward_ios
Recommended textbooks for you
 Big Ideas Math A Bridge To Success Algebra 1: Stu...AlgebraISBN:9781680331141Author:HOUGHTON MIFFLIN HARCOURTPublisher:Houghton Mifflin Harcourt
 Glencoe Algebra 1, Student Edition, 9780079039897...AlgebraISBN:9780079039897Author:CarterPublisher:McGraw Hill
 Calculus For The Life SciencesCalculusISBN:9780321964038Author:GREENWELL, Raymond N., RITCHEY, Nathan P., Lial, Margaret L.Publisher:Pearson Addison Wesley,
 Holt Mcdougal Larson Pre-algebra: Student Edition...AlgebraISBN:9780547587776Author:HOLT MCDOUGALPublisher:HOLT MCDOUGAL
Big Ideas Math A Bridge To Success Algebra 1: Stu...
Algebra
ISBN:9781680331141
Author:HOUGHTON MIFFLIN HARCOURT
Publisher:Houghton Mifflin Harcourt
Glencoe Algebra 1, Student Edition, 9780079039897...
Algebra
ISBN:9780079039897
Author:Carter
Publisher:McGraw Hill
Calculus For The Life Sciences
Calculus
ISBN:9780321964038
Author:GREENWELL, Raymond N., RITCHEY, Nathan P., Lial, Margaret L.
Publisher:Pearson Addison Wesley,
Holt Mcdougal Larson Pre-algebra: Student Edition...
Algebra
ISBN:9780547587776
Author:HOLT MCDOUGAL
Publisher:HOLT MCDOUGAL
Hypothesis Testing using Confidence Interval Approach; Author: BUM2413 Applied Statistics UMP;https://www.youtube.com/watch?v=Hq1l3e9pLyY;License: Standard YouTube License, CC-BY
Hypothesis Testing - Difference of Two Means - Student's -Distribution & Normal Distribution; Author: The Organic Chemistry Tutor;https://www.youtube.com/watch?v=UcZwyzwWU7o;License: Standard Youtube License