
Introduction To Managerial Accounting
8th Edition
ISBN: 9781259917066
Author: BREWER, Peter C., Garrison, Ray H., Noreen, Eric W.
Publisher: Mcgraw-hill Education,
expand_more
expand_more
format_list_bulleted
Videos
Textbook Question
Chapter 14, Problem 9F15
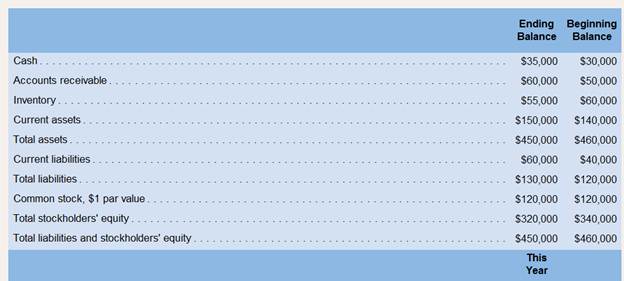
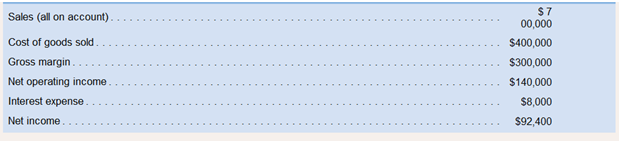
Markus Company’s common stock sold for $2.75 per share at the end of this. The company paid a common stock dividend of $0.55 per share this year. It also provided the following data excerpts from this rears financial statements:
Required:
9. What is the
Expert Solution & Answer
Want to see the full answer?
Check out a sample textbook solution
Students have asked these similar questions
The comparative financial statements of Stargel Inc. are as follows. The market price of Stargel common stock was $119.70 on December 31, 20Y2.
Please see the attachment for details:
InstructionsDetermine the following measures for 20Y2, rounding to one decimal place including percentages, except for per-share amounts:1. Working capital2. Current ratio3. Quick ratio4. Accounts receivable turnover5. Number of days’ sales in receivables6. Inventory turnover7. Number of days’ sales in inventory8. Ratio of fixed assets to long-term liabilities9. Ratio of liabilities to stockholders’ equity10. Times interest earned11. Asset turnover12. Return on total assets13. Return on stockholders’ equity14. Return on common stockholders’ equity15. Earnings per share on common stock16. Price-earnings ratio17. Dividends per share of common stock18. Dividend yield
The following data were taken from the balance sheet of Albertini Company at the end of two recent fiscal years:
Current Year
Previous Year
Current assets:
Cash
Marketable securities
Accounts and notes receivable (net)
Inventories
Prepaid expenses
Total current assets
Current liabilities:
Accounts and notes payable
(short-term)
Accrued liabilities
Total current liabilities.
$620,500
718,500
294,000
749,800
386,200
$2,769,000
1. Working capital
2. Current ratio
3. Quick ratio
b. The liquidity of Albertini has
in current assets relative to current liabilities.
$411,800
298,200
$710,000
$496,000
558,000
186,000
529,500
338,500
$2,108,000
$434,000
186,000
$620,000
a. Determine for each year (1) the working capital, (2) the current ratio, and (3) the quick ratio. Round ratios to one decimal place.
Current Year
Previous Year
from the preceding year to the current year. The working capital, current ratio, and quick ratio have all
Most of these changes are the result of an
The comparative financial statements of Marshall Inc. are as follows. The market price of Marshall common stock was $82.60 on December 31, 20Y2.
Please see the attachment for details:
Instructions
Determine the following measures for 20Y2, rounding to one decimal place, including percentages, except for per-share amounts:1. Working capital2. Current ratio3. Quick ratio4. Accounts receivable turnover5. Number of days’ sales in receivables6. Inventory turnover7. Number of days’ sales in inventory8. Ratio of fixed assets to long-term liabilities9. Ratio of liabilities to stockholders’ equity10. Times interest earned11. Asset turnover12. Return on total assets13. Return on stockholders’ equity14. Return on common stockholders’ equity15. Earnings per share on common stock16. Price-earnings ratio17. Dividends per share of common stock18. Dividend yield
Chapter 14 Solutions
Introduction To Managerial Accounting
Ch. 14 - Prob. 1QCh. 14 - What is the basic purpose for examining trends in...Ch. 14 - Prob. 3QCh. 14 - Prob. 4QCh. 14 - What is meant by the dividend yield on a common...Ch. 14 - What is meant by the term financial leverage?Ch. 14 - Prob. 7QCh. 14 - Prob. 8QCh. 14 - Prob. 9QCh. 14 - Markus Company’s common stock sold for $2.75 per...
Ch. 14 - Markus Company’s common stock sold for $2.75 per...Ch. 14 - Markus Company’s common stock sold for $2.75 per...Ch. 14 - Markus Company’s common stock sold for $2.75 per...Ch. 14 - Markus Company’s common stock sold for $2.75 per...Ch. 14 - Markus Company’s common stock sold for $2.75 per...Ch. 14 - Markus Company’s common stock sold for $2.75 per...Ch. 14 - Markus Company’s common stock sold for $2.75 per...Ch. 14 - Markus Company’s common stock sold for $2.75 per...Ch. 14 - Markus Company’s common stock sold for $2.75 per...Ch. 14 - Prob. 11F15Ch. 14 - Prob. 12F15Ch. 14 - Prob. 13F15Ch. 14 - Prob. 14F15Ch. 14 - Prob. 15F15Ch. 14 - Common-Size Income Statement A comparative income...Ch. 14 - Prob. 2ECh. 14 - Prob. 3ECh. 14 - Financial Ratios for Debt Management Refer to the...Ch. 14 - Prob. 5ECh. 14 - Prob. 6ECh. 14 - Prob. 7ECh. 14 - Prob. 8ECh. 14 - Financial Ratios for Assessing Profitability and...Ch. 14 - Prob. 10ECh. 14 - Prob. 11ECh. 14 - Selected Financial Measures for Assessing...Ch. 14 - Effects of Transactions on Various Financial...Ch. 14 - Effects of Transactions on Various Ratios Denna...Ch. 14 - Prob. 15PCh. 14 - Common-Size Financial StatementsRefer to the...Ch. 14 - Interpretation of Financial Ratios Pecunious...Ch. 14 - Common-Size Statements and Financial Ratios for a...Ch. 14 - Financial Ratios for Assessing Profitability and...
Knowledge Booster


Learn more about
Need a deep-dive on the concept behind this application? Look no further. Learn more about this topic, accounting and related others by exploring similar questions and additional content below.Similar questions
- Juroe Company provided the following income statement for last year: Juroes balance sheet as of December 31 last year showed total liabilities of 10,250,000, total equity of 6,150,000, and total assets of 16,400,000. Required: Note: Round answers to two decimal places. 1. Calculate the times-interest-earned ratio. 2. Calculate the debt ratio. 3. Calculate the debt-to-equity ratio.arrow_forwardMeasures of liquidity, solvency, and profitability The comparative financial statements of Marshall Inc. are as follows. The market price of Marshall common stock was 82.60 on December 31, 20Y2. Instructions Determine the following measures for 20Y2 (round to one decimal place, including percentages, except for per-share amounts): 1. Working capital 2. Current ratio 3. Quick ratio 4. Accounts receivable turnover 5. Number of days sales in receivables 6. Inventory turnover 7. Number of days sales in inventory 8. Ratio of fixed assets to long-term liabilities 9. Ratio of liabilities to stockholders equity 10. Times interest earned 11. Asset turnover 12. Return on total assets 13. Return on stockholders equity 14. Return on common stockholders equity 15. Earnings per share on common stock 16. Price-earnings ratio 17. Dividends per share of common stock 18. Dividend yieldarrow_forwardMeasures of liquidity, solvency, and profitability The comparative financial statements of Marshall Inc. are as follows. The market price of Marshall common stock was 82.60 on December 31, 20Y2. Instructions Determine the following measures for 20Y2, rounding to one decimal place, including percentages, except for per-share amounts: 1. Working capital 2. Current ratio 3. Quick ratio 4. Accounts receivable turnover 5. Number of days sales in receivables 6. Inventory turnover 7. Number of days sales in inventory 8. Ratio of fixed assets to long-term liabilities 9. Ratio of liabilities to stockholders equity 10. Times interest earned 11. Asset turnover 12. Return on total assets 13. Return on stockholders equity 14. Return on common stockholders equity 15. Earnings per share on common stock 16. Price-earnings ratio 17. Dividends per share of common stock 18. Dividend yieldarrow_forward
- The following data were taken from the balance sheet of Nilo Company at the end of two recent fiscal years: Current assets: Cash Marketable securities Accounts and notes receivable (net) Inventories Prepaid expenses Total current assets Current liabilities: Accounts and notes payable (short-term) Accrued liabilities Total current liabilities 1. Working capital 2. Current ratio 3. Quick ratio Current Year Current Year $347,700 402,600 164,700 603,900 311,100 $1,830,000 $353,800 256,200 $610,000 Previous Year $254,400 286,200 95,400 420,300 268,700 $1,325,000 Determine for each year (1) the working capital, (2) the current ratio, and (3) the quick ratio. Round ratios to one decimal place. $371,000 159,000 $530,000 Previous Yeararrow_forwardWhat is the Days Payables Outstanding? Use the attached financial data to calculate the ratios. Round to the nearest decimal. Abercrombie & Fitch Co (ANF) Financial Data Revenues Cost of Sales Total Operating Expenses Interest Expense Income Tax Expense Diluted Weighted Shares Outstanding Cash + Equivalents Accounts Receivable Inventories Total Current Assets Total Assets Accounts Payable Total Current Liabilities Total Stockholders' Equity ANF Stock Price = $10.30 Select one O A. 42.3 days, 37.0 days OB. 76.1 days, 89.4 days OC. 89.4 days, 37.0 days OD. 76.1 days, 97.7 days 2022 $3,659.3 $1,545.9 $2,026.9 $28.5 $37.8 52.8 $257.3 $108.5 $742.0 $1,220.4 $2,694.0 $322.1 $935.5 $656.1 2021 $3,712.8 $1,400.8 $1,968.9 $34.1 $38.9 62.6 $823.1 $69.1 $525.9 $1,507.8 $2,939.5 $374.8 $1,015.2 $826.1arrow_forwardThe following data were taken from the balance sheet of Nilo Company at the end of two recent fiscal years: Current Year Previous Year Current assets: Cash Marketable securities Accounts and notes receivable (net) Inventories Prepaid expenses Total current assets Current liabilities: Accounts and notes payable (short-term) Accrued liabilities Total current liabilities 1. Working capital 2. Current ratio $310,100 359,000 146,900 570,200 293,800 $1,680,000 3. Quick ratio $278,400 201,600 $480,000 a. Determine for each year (1) the working capital, (2) the current ratio, and (3) the quick ratio. Round ratios to one decimal place. Current Year Previous Year $ $252,000 283,500 94,500 358,700 229,300 $1,218,000 $294,000 126,000 $420,000arrow_forward
- The comparative Financial statements of Marshall Inc. are as follows. The market price of Marshall common stock was $82.60 on December 31, 20Y2. InstructionsDetermine the following measures for 20Y2. Round to one decimal place, including percentages, except for per-share amounts, which should be rounded to the nearest cent.1. Working capital2. Current ratio 3- Quick ratio4. Accounts receivable turnover5. Number of days' sales in receivables6. Inventory turnover7. Number of days' sales in inventory8. Ratio of fixed assets to long-term liabilities 9- Ratio of liabilities to stockholders' equity10. Times interest earned11. Asset turnover12. Return on total assets13. Return on stockholders' equity14. Return on common stockholders' equity15. Earnings per share on common stock16. Price-earnings ratio17. Dividends per share of common stock18. Dividend yieldarrow_forwardMarkus Company's common stock sold for $5.25 per share at the end of this year. The company paid a common stock dividend of $0.63 per share this year. It also provided the following data excerpts from this year's financial statements: Cash Accounts receivable Inventory Current assets Total assets Current liabilities Total liabilities Common stock, $1 par value Total stockholders' equity Total liabilities and stockholders' equity Sales (all on account) Cost of goods sold Gross margin Net operating income Interest expense Net income This Year $ 1,095,000 $ 635,100 $ 459,900 $ 313,875 $ 15,500 $ 208,862 Accounts receivable turnover Average collection period Answer is complete but not entirely correct. 13.62 26.76 days Ending Balance $ 49,000 $ 92,000 $ 76,300 $ 217,300 $ 801,000 $ 85,500 $ 206,000 $ 165,000 $ 595,000 $ 801,000 Beginning Balance $ 44,200 $ 68,700 $ 92,000 $ 204,900 $ 875,400 Foundational 14-9 (Algo) 9. What is the accounts receivable turnover and the average collection…arrow_forwardAccount balances at the beginning of the year were: accounts receivable, $190,000; and inventory, $290,000. All sales were on account. Assume that Castile Products, Incorporated paid dividends of $3.95 per share during the year. Also assume that the company's common stock had a market price of $70 at the end of the year and there was no change in the number of outstanding shares of common stock during the year. Required: Compute financial ratios as follows: 1. Earnings per share. (Round your answer to 2 decimal places.) 2. Dividend payout ratio. (Round your intermediate calculations to 2 decimal places. Round your percentage final answer to 2 decimal places.) 3. Dividend yield ratio. (Round your percentage answer to 2 decimal places.) 4. Price-earnings ratio. (Round your intermediate calculations and final answer to 2 decimal places.) 5. Book value per share. (Round your answer to 2 decimal places.) 1. Earnings per share 2. Dividend payout ratio % 3. Dividend yield ratio % 3.…arrow_forward
- The comparative financial statements of Stargel Inc. are as follows. The market price of Stargel common stock was $119.70 on December 31, 20Y2. InstructionsDetermine the following measures for 20Y2. Round to one decimal place including percentages, except for per-share amounts, which should be rounded to the nearest cent.1. Working capital2. Current ratio3. Quick ratio4. Accounts receivable turnover5. Number of days' sales in receivables6. Inventor)’ turnover7. Number of days' sales in inventoryarrow_forwardDetermine the following measures for 20Y2, rounding to one decimal place including, percentage, except for per-share amounts. 5. Number of days sales in receivables 7. number of days sale in inventory 12. return on total asset 14. return on common stockholders equity 17. dividends per share of common stock 18. dividend yield i need help on these questions i have provided please please pleasearrow_forward[The following information applies to the questions displayed below.] Markus Company’s common stock sold for $5.25 per share at the end of this year. The company paid a common stock dividend of $0.63 per share this year. It also provided the following data excerpts from this year’s financial statements: EndingBalance BeginningBalance Cash $ 49,000 $ 44,200 Accounts receivable $ 92,000 $ 68,700 Inventory $ 76,300 $ 92,000 Current assets $ 217,300 $ 204,900 Total assets $ 801,000 $ 875,400 Current liabilities $ 85,500 $ 90,000 Total liabilities $ 206,000 $ 185,400 Common stock, $1 par value $ 165,000 $ 165,000 Total stockholders’ equity $ 595,000 $ 690,000 Total liabilities and stockholders’ equity $ 801,000 $ 875,400 This Year Sales (all on account) $ 1,095,000 Cost of goods sold $ 635,100 Gross margin $ 459,900 Net operating income $ 313,875 Interest expense $ 15,500 Net income $ 208,862 5. What is the return…arrow_forward
arrow_back_ios
SEE MORE QUESTIONS
arrow_forward_ios
Recommended textbooks for you
 Managerial Accounting: The Cornerstone of Busines...AccountingISBN:9781337115773Author:Maryanne M. Mowen, Don R. Hansen, Dan L. HeitgerPublisher:Cengage Learning
 Managerial AccountingAccountingISBN:9781337912020Author:Carl Warren, Ph.d. Cma William B. TaylerPublisher:South-Western College Pub
 Financial And Managerial AccountingAccountingISBN:9781337902663Author:WARREN, Carl S.Publisher:Cengage Learning,
 Financial AccountingAccountingISBN:9781337272124Author:Carl Warren, James M. Reeve, Jonathan DuchacPublisher:Cengage Learning
Managerial Accounting: The Cornerstone of Busines...
Accounting
ISBN:9781337115773
Author:Maryanne M. Mowen, Don R. Hansen, Dan L. Heitger
Publisher:Cengage Learning
Managerial Accounting
Accounting
ISBN:9781337912020
Author:Carl Warren, Ph.d. Cma William B. Tayler
Publisher:South-Western College Pub
Financial And Managerial Accounting
Accounting
ISBN:9781337902663
Author:WARREN, Carl S.
Publisher:Cengage Learning,
Financial Accounting
Accounting
ISBN:9781337272124
Author:Carl Warren, James M. Reeve, Jonathan Duchac
Publisher:Cengage Learning
Earnings per share (EPS), basic and diluted; Author: Bionic Turtle;https://www.youtube.com/watch?v=i2IJTpvZmH4;License: Standard Youtube License