
Videos
Interpretation of Financial Ratios
Pecunious Products, Inc.'s financial results for the past three years are summarized below:
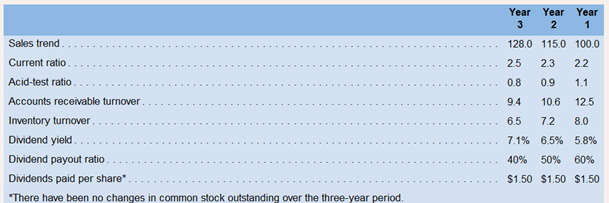
Your boss has asked you to review these results and then answer the following questions:
a. Is it becoming easier for the company to pay its bills as they come due?
b. Are customers paying their accounts at least as fast now as they were in Year 1?
c. Is the total of the
d. Is the level of inventory increasing, decreasing, or remaining constant?
e. Is the market price of the company's stock going up or down?
f. Is the earnings per share increasing or decreasing?
g. Is the price-earning ratio going up or down?
Required:
Provide answers to each of the questions raised by your boss.
Want to see the full answer?
Check out a sample textbook solution
Chapter 14 Solutions
Introduction To Managerial Accounting


- When analyzing financial statements, what can you conclude when the accounts receivable turnover ratio decreases from 9.0 to 6.0 over a three year period. Group of answer choices None of the above b. The collection period has increased over time a. Collections are within standard terms c. The collection period has decreased over timearrow_forwardYou are an investor looking to contribute financially to either company A or Company B. The following, select financial information as follows. Company A and company B, respectively: Beginning Account Receivable $ 50,000, 60,000; Ending Account Receivable $ 80,000, 90,000; Net credit sales $ 550,000, $460,000. Based on the information provided: compute the account receivable turnover ratio. Compute the number of days sales in receivables ratio for both companies A and company B ( round all answers to two decimals places) Interpret the outcomes stating which company you would invest in and why.arrow_forwardIdentify the ratio that is relevant to answering each of the following questions.a. How much net income does the company earn from each dollar of sales?b. Is the company financed primarily by debt or equity?c. How many dollars of sales were generated for each dollar invested in fixed assets?d. How many days, on average, does it take the company to collect on credit sales made tocustomers?e. How much net income does the company earn for each dollar owners have invested in it?f. Does the company have sufficient assets to convert into cash for paying liabilities as theycome due in the upcoming year?arrow_forward
- Grammatico Company has just completed its third year of operations. The income statement is as follows: Selected information from the balance sheet is as follows: Required: Note: Round answers to two decimal places. 1. Compute the times-interest-earned ratio. 2. Compute the debt ratio. 3. CONCEPTUAL CONNECTION Assume that the lower quartile, median, and upper quartile values for debt and times-interest-earned ratios in Grammaticos industry are as follows: How does Grammatico compare with the industrial norms? Does it have too much debt?arrow_forwardConsider again the example introduced in Section 4.5 of a credit card company that has a database of information provided by its customers when the customers apply for credit cards. An analyst has created a multiple regression model for which the dependent variable in the model is credit card charges accrued by a customer in the data set over the past year (y), and the independent variables are the customers annual household income (x1), number of members of the household (x2), and number of years of posthigh school education (x3). Figure 4.23 provides Excel output for a multiple regression model estimated using a data set the company created. a. Estimate the corresponding simple linear regression with the customers annual household income as the independent variable and credit card charges accrued by a customer over the past year as the dependent variable. Interpret the estimated relationship between the customers annual household income and credit card charges accrued over the past year. How much variation in credit card charges accrued by a customer over the past year does this simple linear regression model explain? b. Estimate the corresponding simple linear regression with the number of members in the customers household as the independent variable and credit card charges accrued by a customer over the past year as the dependent variable. Interpret the estimated relationship between the number of members in the customers household and credit card charges accrued over the past year. How much variation in credit card charges accrued by a customer over the past year does this simple linear regression model explain? c. Estimate the corresponding simple linear regression with the customers number of years of posthigh school education as the independent variable and credit card charges accrued by a customer over the past year as the dependent variable. Interpret the estimated relationship between the customers number of years of posthigh school education and credit card charges accrued over the past year. How much variation in credit card charges accrued by a customer over the past year does this simple linear regression model explain? d. Recall the multiple regression in Figure 4.23 with credit card charges accrued by a customer over the past year as the dependent variable and customers annual household income (x1), number of members of the household (x2), and number of years of posthigh school education (x3) as the independent variables. Do the estimated slopes differ substantially from the corresponding slopes that were estimated using simple linear regression in parts a, b, and c? What does this tell you about multicollinearity in the multiple regression model in Figure 4.23? e. Add the coefficients of determination for the simple linear regression in parts a, b, and c, and compare the result to the coefficient of determination for the multiple regression model in Figure 4.23. What does this tell you about multicollinearity in the multiple regression model in Figure 4.23? f. Add age, a dummy variable for gender, and a dummy variable for whether a customer has exceeded his or her credit limit in the past 12 months as independent variables to the multiple regression model in Figure 4.23. Code the dummy variable for gender as 1 if the customers gender is female and 0 if male, and code the dummy variable for whether a customer has exceeded his or her credit limit in the past 12 months as 1 if the customer has exceeded his or her credit limit in the past 12 months and 0 otherwise. Do these variables substantially improve the fit of your model?arrow_forwardRick's Travel Service has asked you to help piece together financial information on the firm for the most current year. Managers give you the following information: sales are $7.4 million, total debt is $2.00 million, debt ratio is 35 percent, and ROE is 17.1 percent. Using the above information, calculate Rick's ROA. Note: Round your answer to 2 decimal places. ROA %arrow_forward
- calculate the • efficiency ratios, • liquidity ratios, • leverage ratios, and • profitability ratios for KPC Corporation for this year. Where data is available, also calculate ratios for last year. Use a 360-day year. All sales are on credit to business customers. Assume an income tax rate of 30 percent.arrow_forwardRick’s Travel Service has asked you to help piece together financial information on the firm for the most current year. Managers give you the following information: sales are $7.5 million, total debt is $3.00 million, debt ratio is 55 percent, and ROE is 17.2 percent. Using the above information, calculate Rick’s ROA. (Round your answer to 2 decimal places.) ROA _________ %arrow_forwardA professional service firm at the end of the current fiscal year had a Total Revenue of $8,500,000 and accounts receivable of $2,000,000. If its accounts receivable at the end of the previous year was $2,200,000, what is this business' Receivable Turnover (RT) and Days' Collections (DC)? Write out your matharrow_forward
- What is the amount of working capital and the current ratio at the end of this year? What is the acid - test ratio at the end of this year? What is the accounts receivable turnover and the average collection period? What is the inventory turnover and the average sale period? What is the company's operating cycle? What is the total asset turnover? What is the times interest earned ratio? What is the debt-to-equity ratio at the end of this year? Markus Company's common stock sold for $2.75 per share at the end of this year. The company paid a common stock dividend of $0.55 per share this year. It also provided the following data excerpts from this year's financial statements: Ending Balance Beginning Balance Cash Accounts receivable Inventory Current assets Total assets Current liabilities Total liabilities Common stock, $1 par value Total stockholders' equity Total liabilities and stockholders' equity Sales (all on account) Cost of goods sold Gross margin Net operating income Interest…arrow_forwardHello, I need formulas explaining the answers, thank you. Horizontal analysis for sales and Account receivable, comment on your answer -- good news or bad news Calculate the Current Ratio (for two years) and the Quick Ratio (for two years), comment on the trend. Activity Ratio --- Account Receivable (Turnover Ratio and Days to Collect) for 2 years Activity Ratio --- Inventory (Turnover Ratio and Days to Collect for 2 yearsarrow_forwardAlex is currently considering to invest his money in one of the companies betweenCompany A and Company B. The summarized final accounts of the companies for theirlast completed financial year are as follows: (refer to the images) Required:a. Calculate the following ratios for Company A and Company B. State clearly theformulae used for each ratio:i. Gross Profit Marginii. Net Profit Marginiii. Inventory Turnover Period (days)iv. Receivables Collection Period (days)v. Payables Payment Period (days)vi. Current Ratiovii. Quick Ratiob. Comment on each of the ratios calculated in part (a) above.arrow_forward
 Financial Accounting: The Impact on Decision Make...AccountingISBN:9781305654174Author:Gary A. Porter, Curtis L. NortonPublisher:Cengage Learning
 Managerial Accounting: The Cornerstone of Busines...AccountingISBN:9781337115773Author:Maryanne M. Mowen, Don R. Hansen, Dan L. HeitgerPublisher:Cengage Learning
 Essentials Of Business AnalyticsStatisticsISBN:9781285187273Author:Camm, Jeff.Publisher:Cengage Learning,
 Financial Reporting, Financial Statement Analysis...FinanceISBN:9781285190907Author:James M. Wahlen, Stephen P. Baginski, Mark BradshawPublisher:Cengage Learning