
Mathematical Statistics with Applications
7th Edition
ISBN: 9780495110811
Author: Dennis Wackerly, William Mendenhall, Richard L. Scheaffer
Publisher: Cengage Learning
expand_more
expand_more
format_list_bulleted
Concept explainers
Videos
Textbook Question
Chapter 11.5, Problem 25E
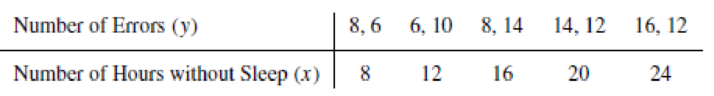
Do the data in Exercise 11.19 present sufficient evidence to indicate that the number of errors is linearly related to the number of hours without sleep?
- a Give bounds on the attained significance level.
- b Applet Exercise Determine the exact p-value.
- c Based on your answers to parts (a) and/or (b), what would you conclude at the α = .05 level of significance?
- d Would you expect the relationship between y and x to be linear if x were varied over a wider
range , say, from x = 4 to x = 48? - e Give a 95% confidence interval for the slope. Provide a practical interpretation for this
interval estimate.
11.19 A study was conducted to determine the effects of sleep deprivation on subjects’ ability to solve simple problems. The amount of sleep deprivation varied over 8, 12, 16, 20, and 24 hours without sleep. A total of ten subjects participated in the study, two at each sleep-deprivation level. After his or her specified sleep-deprivation period, each subject was administered a set of simple addition problems, and the number of errors was recorded. The results shown in the following table were obtained.
- a Find the least-squares line appropriate to these data.
- b Plot the points and graph the least-squares line as a check on your calculations.
- c Calculate S2.
Expert Solution & Answer
Want to see the full answer?
Check out a sample textbook solution
Students have asked these similar questions
A study of the effect of massage on boxing performance measured a boxer's blood lactate concentration (in mM) and perceived recovery (on a 28-point scale). On the basis of the information provided by the study, the data shown in the accompanying table
were obtained for 16 five-round boxing performances in which a massage was given to the boxer between rounds. Conduct a test to determine whether blood lactate level (y) is linearly related to perceived recovery (x). Use α = 0.10.
Click the icon to view the table of boxer blood data.
X
Boxer Blood Data
Perceived Recovery
Determine the correct null and alternative hypotheses. Choose the correct answer below.
Blood Lactate Level
3.8
4.4
8
8
O A. Ho: B₁ 0
OB. Ho: B₁0, H₂: B₁ 0
4.1
11
5.0
11
=
E. Ho: B₁0, H₂: B₁ #0
OF. Ho: B₁ #0, H₂: B₁ = 0
1
a
1
5.3
11
4.2
14
Find the test statistic.
2.4
17
t = (Round to three decimal places as needed.)
3.7
17
5.3
17
5.8
18
6.0
18
5.9
21
6.3
21
5.5
20
6.5
27
c) Show that the coefficient of determination, R², can also be obtained as the squared
correlation between actual Y values and the Y values estimated from the regression model
where Y is the dependent variable.
Note that the coefficient of correlation between Y and X is
Eyixi
r =
And also that ỹ = ŷ
(18.75)
Sales at an ice creamery are heavily reliant on the weather. A sample of the number of ice creams sold per day and the temperature in degrees Celsius was gathered for
10
days. The temperature was used to predict ice cream sales. The results show that
b1=0.3943
and
Sb1=0.0178.
a. At the 0.05 level of significance, is there evidence of a linear relationship between temperature and ice cream sales?
b. Construct a 95% confidence interval estimate of the population slope,
β1.
Click here to view page 1 of the table of the critical values of t.
LOADING...
Click here to view page 2 of the table of the critical values of t.
LOADING...
a. Determine the hypotheses for the test. Choose the correct answer below.
A.
H0:
β0≥0
H1:
β0<0
B.
H0:
β1=0
H1:
β1≠0
C.
H0:
β1≥0
H1:
β1<0
D.
H0:
β0≤0
H1:
β0>0
E.
H0:
β0=0
H1:
β0≠0
F.
H0:
β1≤0
H1:
β1>0
Calculate the test statistic.
t=enter your…
Chapter 11 Solutions
Mathematical Statistics with Applications
Ch. 11.3 - If 0 and 1 are the least-squares estimates for the...Ch. 11.3 - Prob. 2ECh. 11.3 - Fit a straight line to the five data points in the...Ch. 11.3 - Auditors are often required to compare the audited...Ch. 11.3 - Prob. 5ECh. 11.3 - Applet Exercise Refer to Exercises 11.2 and 11.5....Ch. 11.3 - Prob. 7ECh. 11.3 - Laboratory experiments designed to measure LC50...Ch. 11.3 - Prob. 9ECh. 11.3 - Suppose that we have postulated the model...
Ch. 11.3 - Some data obtained by C.E. Marcellari on the...Ch. 11.3 - Processors usually preserve cucumbers by...Ch. 11.3 - J. H. Matis and T. E. Wehrly report the following...Ch. 11.4 - a Derive the following identity:...Ch. 11.4 - An experiment was conducted to observe the effect...Ch. 11.4 - Prob. 17ECh. 11.4 - Prob. 18ECh. 11.4 - A study was conducted to determine the effects of...Ch. 11.4 - Suppose that Y1, Y2,,Yn are independent normal...Ch. 11.4 - Under the assumptions of Exercise 11.20, find...Ch. 11.4 - Prob. 22ECh. 11.5 - Use the properties of the least-squares estimators...Ch. 11.5 - Do the data in Exercise 11.19 present sufficient...Ch. 11.5 - Use the properties of the least-squares estimators...Ch. 11.5 - Let Y1, Y2, . . . , Yn be as given in Exercise...Ch. 11.5 - Prob. 30ECh. 11.5 - Using a chemical procedure called differential...Ch. 11.5 - Prob. 32ECh. 11.5 - Prob. 33ECh. 11.5 - Prob. 34ECh. 11.6 - For the simple linear regression model Y = 0 + 1x...Ch. 11.6 - Prob. 36ECh. 11.6 - Using the model fit to the data of Exercise 11.8,...Ch. 11.6 - Refer to Exercise 11.3. Find a 90% confidence...Ch. 11.6 - Refer to Exercise 11.16. Find a 95% confidence...Ch. 11.6 - Refer to Exercise 11.14. Find a 90% confidence...Ch. 11.6 - Prob. 41ECh. 11.7 - Suppose that the model Y=0+1+ is fit to the n data...Ch. 11.7 - Prob. 43ECh. 11.7 - Prob. 44ECh. 11.7 - Prob. 45ECh. 11.7 - Refer to Exercise 11.16. Find a 95% prediction...Ch. 11.7 - Refer to Exercise 11.14. Find a 95% prediction...Ch. 11.8 - The accompanying table gives the peak power load...Ch. 11.8 - Prob. 49ECh. 11.8 - Prob. 50ECh. 11.8 - Prob. 51ECh. 11.8 - Prob. 52ECh. 11.8 - Prob. 54ECh. 11.8 - Prob. 55ECh. 11.8 - Prob. 57ECh. 11.8 - Prob. 58ECh. 11.8 - Prob. 59ECh. 11.8 - Prob. 60ECh. 11.9 - Refer to Example 11.10. Find a 90% prediction...Ch. 11.9 - Prob. 62ECh. 11.9 - Prob. 63ECh. 11.9 - Prob. 64ECh. 11.9 - Prob. 65ECh. 11.10 - Refer to Exercise 11.3. Fit the model suggested...Ch. 11.10 - Prob. 67ECh. 11.10 - Fit the quadratic model Y=0+1x+2x2+ to the data...Ch. 11.10 - The manufacturer of Lexus automobiles has steadily...Ch. 11.10 - a Calculate SSE and S2 for Exercise 11.4. Use the...Ch. 11.12 - Consider the general linear model...Ch. 11.12 - Prob. 72ECh. 11.12 - Prob. 73ECh. 11.12 - An experiment was conducted to investigate the...Ch. 11.12 - Prob. 75ECh. 11.12 - The results that follow were obtained from an...Ch. 11.13 - Prob. 77ECh. 11.13 - Prob. 78ECh. 11.13 - Prob. 79ECh. 11.14 - Prob. 80ECh. 11.14 - Prob. 81ECh. 11.14 - Prob. 82ECh. 11.14 - Prob. 83ECh. 11.14 - Prob. 84ECh. 11.14 - Prob. 85ECh. 11.14 - Prob. 86ECh. 11.14 - Prob. 87ECh. 11.14 - Prob. 88ECh. 11.14 - Refer to the three models given in Exercise 11.88....Ch. 11.14 - Prob. 90ECh. 11.14 - Prob. 91ECh. 11.14 - Prob. 92ECh. 11.14 - Prob. 93ECh. 11.14 - Prob. 94ECh. 11 - At temperatures approaching absolute zero (273C),...Ch. 11 - A study was conducted to determine whether a...Ch. 11 - Prob. 97SECh. 11 - Prob. 98SECh. 11 - Prob. 99SECh. 11 - Prob. 100SECh. 11 - Prob. 102SECh. 11 - Prob. 103SECh. 11 - An experiment was conducted to determine the...Ch. 11 - Prob. 105SECh. 11 - Prob. 106SECh. 11 - Prob. 107SE
Knowledge Booster


Learn more about
Need a deep-dive on the concept behind this application? Look no further. Learn more about this topic, statistics and related others by exploring similar questions and additional content below.Similar questions
- Respiratory Rate Researchers have found that the 95 th percentile the value at which 95% of the data are at or below for respiratory rates in breath per minute during the first 3 years of infancy are given by y=101.82411-0.0125995x+0.00013401x2 for awake infants and y=101.72858-0.0139928x+0.00017646x2 for sleeping infants, where x is the age in months. Source: Pediatrics. a. What is the domain for each function? b. For each respiratory rate, is the rate decreasing or increasing over the first 3 years of life? Hint: Is the graph of the quadratic in the exponent opening upward or downward? Where is the vertex? c. Verify your answer to part b using a graphing calculator. d. For a 1- year-old infant in the 95 th percentile, how much higher is the walking respiratory rate then the sleeping respiratory rate? e. f.arrow_forwardB b. What does the scatter diagram developed in part (a) indicate about the relationship between the two variables? The scatter diagram indicates a positive linear relationship between a = average number of passing yar and y = the percentage of games won by the team. c. Develop the estimated regression equation that could be used to predict the percentage of games won given the avera passing yards per attempt. Enter negative value as negative number. WinPct =| |)(Yds/Att) (to 4 decimals) d. Provide an interpretation for the slope of the estimated regression equation (to 1 decimal). The slope of the estimated regression line is approximately So, for every increase : of one yar number of passes per attempt, the percentage of games won by the team increases by %. e. For the 2011 season, the average number of passing yards per attempt for the Kansas City Chiefs was was 5.5. Use th regression equation developed in part (c) to predict the percentage of games won by the Kansas City Chiefs.…arrow_forward
Recommended textbooks for you
 Calculus For The Life SciencesCalculusISBN:9780321964038Author:GREENWELL, Raymond N., RITCHEY, Nathan P., Lial, Margaret L.Publisher:Pearson Addison Wesley,
 Algebra & Trigonometry with Analytic GeometryAlgebraISBN:9781133382119Author:SwokowskiPublisher:Cengage
 Glencoe Algebra 1, Student Edition, 9780079039897...AlgebraISBN:9780079039897Author:CarterPublisher:McGraw Hill
 Big Ideas Math A Bridge To Success Algebra 1: Stu...AlgebraISBN:9781680331141Author:HOUGHTON MIFFLIN HARCOURTPublisher:Houghton Mifflin Harcourt
 Functions and Change: A Modeling Approach to Coll...AlgebraISBN:9781337111348Author:Bruce Crauder, Benny Evans, Alan NoellPublisher:Cengage Learning
Calculus For The Life Sciences
Calculus
ISBN:9780321964038
Author:GREENWELL, Raymond N., RITCHEY, Nathan P., Lial, Margaret L.
Publisher:Pearson Addison Wesley,
Algebra & Trigonometry with Analytic Geometry
Algebra
ISBN:9781133382119
Author:Swokowski
Publisher:Cengage
Glencoe Algebra 1, Student Edition, 9780079039897...
Algebra
ISBN:9780079039897
Author:Carter
Publisher:McGraw Hill
Big Ideas Math A Bridge To Success Algebra 1: Stu...
Algebra
ISBN:9781680331141
Author:HOUGHTON MIFFLIN HARCOURT
Publisher:Houghton Mifflin Harcourt
Functions and Change: A Modeling Approach to Coll...
Algebra
ISBN:9781337111348
Author:Bruce Crauder, Benny Evans, Alan Noell
Publisher:Cengage Learning
Correlation Vs Regression: Difference Between them with definition & Comparison Chart; Author: Key Differences;https://www.youtube.com/watch?v=Ou2QGSJVd0U;License: Standard YouTube License, CC-BY
Correlation and Regression: Concepts with Illustrative examples; Author: LEARN & APPLY : Lean and Six Sigma;https://www.youtube.com/watch?v=xTpHD5WLuoA;License: Standard YouTube License, CC-BY